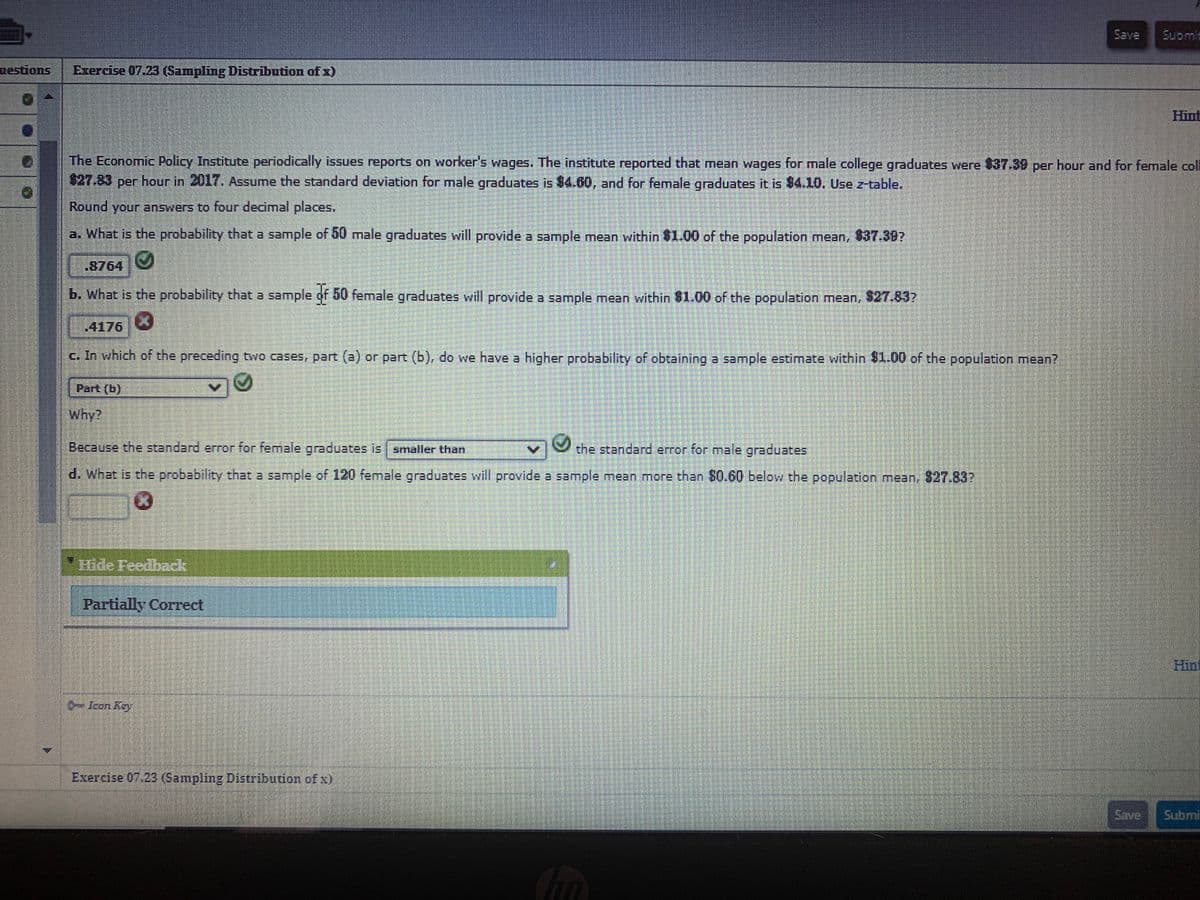
The economic policy Institute periodically issues reports on workers wages. The Institute reported that mean wages for male college graduates were $37.39 per hour and for female college graduates were $27.83 per hour in 2017. Assume the standard deviation for male graduates is $4.60, and for female graduates it is $4.10. Use Z table.


The economic policy Institute periodically issues reports on workers wages. The Institute reported that
please answer part b, c, d
a. What is the probability that a sample of 50 mill graduates will provide a sample mean within one dollar of the population mean, $37.39?
b. What is the probability that a sample of 50 female graduates will provide a sample mean within one dollar of the population mean, $27.83?
c. In which of the proceeding two cases, part a or Parville, do we have a higher probability of obtaining A sample estimate within one dollar of the population mean?
why?
Because the standard error for female graduates is blank the standard error for male graduates.
d. What is the probability that a sample of 120 female graduates will provide a sample mean more than $.60 below the population mean, $27.83?


Trending now
This is a popular solution!

Step by step
Solved in 2 steps


