The efficiency for a steel specimen immersed in a phosphating tank is the weight of the phosphate coating divided by the metal loss (both in mg/ft2). An article gave the accompanying data on tank temperature (x) and efficiency ratio (y). 173 174 175 176 Temp. Ratio 0.86 1.41 1.38 1.09 1.05 1.00 0.94 1.86 y= Temp. 181 181 181 Ratio 171 181 LAUSE SALT 175 181 Temp. 183 183 183 185 185 Ratio 1.75 1.96 2.76 1.53 2.50 (183, 1.96) (183, 2.76) 177 1.55 1.56 1.69 2.15 2.17 0.82 1.49 0.88 178 182 182 183 186 187 189 2.94 1.91 3.06 (a) Determine the equation of the estimated regression line. (Round all numerical values to four decimal places.) (b) Calculate a point estimate for true average efficiency ratio when tank temperature is 183. (Round your answer to four decimal places.) (c) Calculate the values of the residuals from the least squares line for the four observations for which temperature is 183. (Round your answers to two decimal places.). (183, 0.88) (183, 1.75) Why do they not all have the same sign? O These residuals do not all have the same sign because in the case of the third pair of observations, the observed efficiency ratio was equal to the predicted value. In the cases of the other pairs of observations, the observed efficiency ratios were smaller than the predicted value. O These residuals do not all have the same sign because in the case of the second pair of observations, the observed efficiency ratio was equal to the predicted value. In the cases of the other pairs of observations, the observed efficiency ratios were larger than the predicted value. These residuals do not all have the same sign because in the cases of the first two pairs of observations, the observed efficiency ratios were smaller than the predicted value. In the cases of the last two pairs of observations, the observed efficiency ratios were larger than the predicted value. O These residuals do not all have the same sign because in the cases of the first two pairs of observations, the observed efficiency ratios were larger than the predicted value. In the cases of the last two pairs of observations, the observed efficiency ratios were smaller than the predicted value.
The efficiency for a steel specimen immersed in a phosphating tank is the weight of the phosphate coating divided by the metal loss (both in mg/ft2). An article gave the accompanying data on tank temperature (x) and efficiency ratio (y). 173 174 175 176 Temp. Ratio 0.86 1.41 1.38 1.09 1.05 1.00 0.94 1.86 y= Temp. 181 181 181 Ratio 171 181 LAUSE SALT 175 181 Temp. 183 183 183 185 185 Ratio 1.75 1.96 2.76 1.53 2.50 (183, 1.96) (183, 2.76) 177 1.55 1.56 1.69 2.15 2.17 0.82 1.49 0.88 178 182 182 183 186 187 189 2.94 1.91 3.06 (a) Determine the equation of the estimated regression line. (Round all numerical values to four decimal places.) (b) Calculate a point estimate for true average efficiency ratio when tank temperature is 183. (Round your answer to four decimal places.) (c) Calculate the values of the residuals from the least squares line for the four observations for which temperature is 183. (Round your answers to two decimal places.). (183, 0.88) (183, 1.75) Why do they not all have the same sign? O These residuals do not all have the same sign because in the case of the third pair of observations, the observed efficiency ratio was equal to the predicted value. In the cases of the other pairs of observations, the observed efficiency ratios were smaller than the predicted value. O These residuals do not all have the same sign because in the case of the second pair of observations, the observed efficiency ratio was equal to the predicted value. In the cases of the other pairs of observations, the observed efficiency ratios were larger than the predicted value. These residuals do not all have the same sign because in the cases of the first two pairs of observations, the observed efficiency ratios were smaller than the predicted value. In the cases of the last two pairs of observations, the observed efficiency ratios were larger than the predicted value. O These residuals do not all have the same sign because in the cases of the first two pairs of observations, the observed efficiency ratios were larger than the predicted value. In the cases of the last two pairs of observations, the observed efficiency ratios were smaller than the predicted value.

Functions and Change: A Modeling Approach to College Algebra (MindTap Course List)
6th Edition
ISBN:9781337111348
Author:Bruce Crauder, Benny Evans, Alan Noell
Publisher:Bruce Crauder, Benny Evans, Alan Noell
Chapter5: A Survey Of Other Common Functions
Section5.2: Power Functions
Problem 17E: Tsunami Waves and BreakwatersThis is a continuation of Exercise 16. Breakwaters affect wave height...

Related questions
Question
4. Please answer a,b,c,d ty!
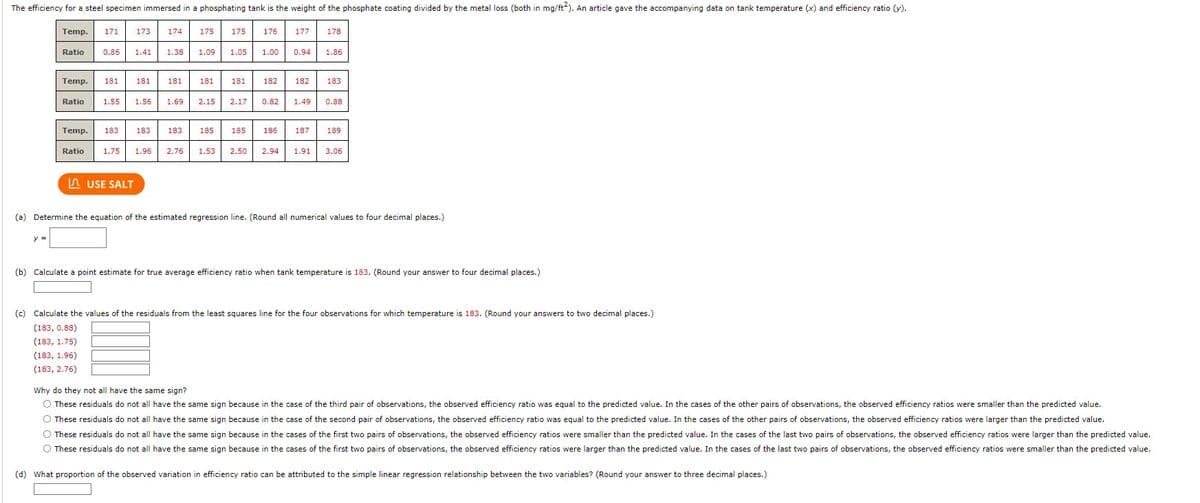
Transcribed Image Text:The efficiency for a steel specimen immersed in a phosphating tank is the weight of the phosphate coating divided by the metal loss (both in mg/ft2). An article gave the accompanying data on tank temperature (x) and efficiency ratio (y).
Temp. 171 173
y =
Temp. 181 181
Ratio 0.86 1.41 1.38 1.09
Ratio
Temp. 183
Ratio
174
183
LUSE SALT
181
1.55 1.56 1.69 2.15
175
183
181
185
175
1.05
181
185
1.75 1.96 2.76 1.53 2.50
176
177
2.17 0.82 1.49
178
1.00 0.94 1.86
182 182 183
0.88
186 187 189
2.94 1.91 3.06
(a) Determine the equation of the estimated regression line. (Round all numerical values to four decimal places.)
(b) Calculate a point estimate for true average efficiency ratio when tank temperature is 183. (Round your answer to four decimal places.)
(c) Calculate the values of the residuals from the least squares line for the four observations for which temperature is 183. (Round your answers to two decimal places.)
(183, 0.88)
(183, 1.75)
(183, 1.96)
(183, 2.76)
Why do they not all have the same sign?
O These residuals do not all have the same sign because in the case of the third pair of observations, the observed efficiency ratio was equal to the predicted value. In the cases of the other pairs of observations, the observed efficiency ratios were smaller than the predicted value.
O These residuals do not all have the same sign because in the case of the second pair of observations, the observed efficiency ratio was equal to the predicted value. In the cases of the other pairs of observations, the observed efficiency ratios were larger than the predicted value.
O These residuals do not all have the same sign because in the cases of the first two pairs of observations, the observed efficiency ratios were smaller than the predicted value. In the cases of the last two pairs of observations, the observed efficiency ratios were larger than the predicted value.
O These residuals do not all have the same sign because in the cases of the first two pairs of observations, the observed efficiency ratios were larger than the predicted value. In the cases of the last two pairs of observations, the observed efficiency ratios were smaller than the predicted value.
(d) What proportion of the observed variation in efficiency ratio can be attributed to the simple linear regression relationship between the two variables? (Round your answer to three decimal places.)
Expert Solution
This question has been solved!
Explore an expertly crafted, step-by-step solution for a thorough understanding of key concepts.

This is a popular solution!

Trending now
This is a popular solution!

Step by step
Solved in 4 steps

Recommended textbooks for you
Functions and Change: A Modeling Approach to Coll…
Algebra
ISBN:
9781337111348
Author:
Bruce Crauder, Benny Evans, Alan Noell
Publisher:
Cengage Learning


Algebra & Trigonometry with Analytic Geometry
Algebra
ISBN:
9781133382119
Author:
Swokowski
Publisher:
Cengage
Functions and Change: A Modeling Approach to Coll…
Algebra
ISBN:
9781337111348
Author:
Bruce Crauder, Benny Evans, Alan Noell
Publisher:
Cengage Learning
Algebra & Trigonometry with Analytic Geometry
Algebra
ISBN:
9781133382119
Author:
Swokowski
Publisher:
Cengage

Algebra: Structure And Method, Book 1
Algebra
ISBN:
9780395977224
Author:
Richard G. Brown, Mary P. Dolciani, Robert H. Sorgenfrey, William L. Cole
Publisher:
McDougal Littell

College Algebra (MindTap Course List)
Algebra
ISBN:
9781305652231
Author:
R. David Gustafson, Jeff Hughes
Publisher:
Cengage Learning

Algebra and Trigonometry (MindTap Course List)
Algebra
ISBN:
9781305071742
Author:
James Stewart, Lothar Redlin, Saleem Watson
Publisher:
Cengage Learning