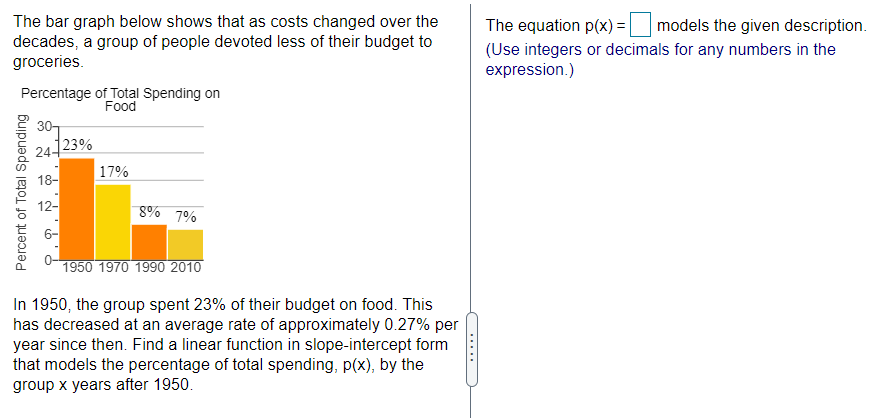
The equation p(x) = | models the given description. The bar graph below shows that as costs changed over the decades, a group of people devoted less of their budget to groceries. (Use integers or decimals for any numbers in the expression.) Percentage of Total Spending on Food 30 23% |17% 18- 8% 7% 1950 1970 1990 2010 In 1950, the group spent 23% of their budget on food. This has decreased at an average rate of approximately 0.27% per year since then. Find a linear function in slope-intercept form that models the percentage of total spending, p(x), by the group x years after 1950. Percent of Total Spending .....
The equation p(x) = | models the given description. The bar graph below shows that as costs changed over the decades, a group of people devoted less of their budget to groceries. (Use integers or decimals for any numbers in the expression.) Percentage of Total Spending on Food 30 23% |17% 18- 8% 7% 1950 1970 1990 2010 In 1950, the group spent 23% of their budget on food. This has decreased at an average rate of approximately 0.27% per year since then. Find a linear function in slope-intercept form that models the percentage of total spending, p(x), by the group x years after 1950. Percent of Total Spending .....

Glencoe Algebra 1, Student Edition, 9780079039897, 0079039898, 2018
18th Edition
ISBN:9780079039897
Author:Carter
Publisher:Carter
Chapter2: Linear Equations
Section: Chapter Questions
Problem 2PFA

Related questions
Question
Transcribed Image Text:The equation p(x) = |
models the given description.
The bar graph below shows that as costs changed over the
decades, a group of people devoted less of their budget to
groceries.
(Use integers or decimals for any numbers in the
expression.)
Percentage of Total Spending on
Food
30
23%
|17%
18-
8% 7%
1950 1970 1990 2010
In 1950, the group spent 23% of their budget on food. This
has decreased at an average rate of approximately 0.27% per
year since then. Find a linear function in slope-intercept form
that models the percentage of total spending, p(x), by the
group x years after 1950.
Percent of Total Spending
.....
Expert Solution
This question has been solved!
Explore an expertly crafted, step-by-step solution for a thorough understanding of key concepts.

This is a popular solution!

Trending now
This is a popular solution!

Step by step
Solved in 2 steps with 2 images

Recommended textbooks for you
Glencoe Algebra 1, Student Edition, 9780079039897…
Algebra
ISBN:
9780079039897
Author:
Carter
Publisher:
McGraw Hill

Algebra and Trigonometry (MindTap Course List)
Algebra
ISBN:
9781305071742
Author:
James Stewart, Lothar Redlin, Saleem Watson
Publisher:
Cengage Learning

Trigonometry (MindTap Course List)
Trigonometry
ISBN:
9781337278461
Author:
Ron Larson
Publisher:
Cengage Learning
Glencoe Algebra 1, Student Edition, 9780079039897…
Algebra
ISBN:
9780079039897
Author:
Carter
Publisher:
McGraw Hill
Algebra and Trigonometry (MindTap Course List)
Algebra
ISBN:
9781305071742
Author:
James Stewart, Lothar Redlin, Saleem Watson
Publisher:
Cengage Learning
Trigonometry (MindTap Course List)
Trigonometry
ISBN:
9781337278461
Author:
Ron Larson
Publisher:
Cengage Learning

Algebra & Trigonometry with Analytic Geometry
Algebra
ISBN:
9781133382119
Author:
Swokowski
Publisher:
Cengage

Algebra: Structure And Method, Book 1
Algebra
ISBN:
9780395977224
Author:
Richard G. Brown, Mary P. Dolciani, Robert H. Sorgenfrey, William L. Cole
Publisher:
McDougal Littell

Big Ideas Math A Bridge To Success Algebra 1: Stu…
Algebra
ISBN:
9781680331141
Author:
HOUGHTON MIFFLIN HARCOURT
Publisher:
Houghton Mifflin Harcourt