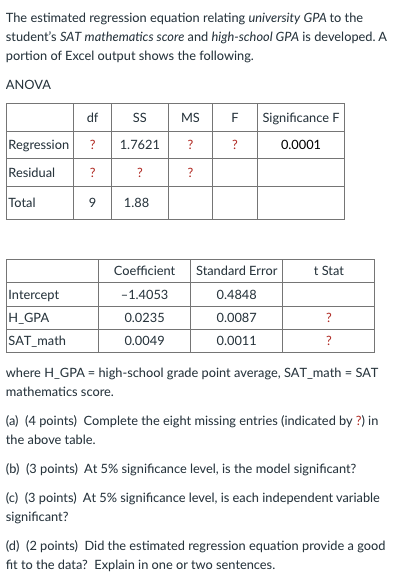
The estimated regression equation relating university GPA to the student's SAT mathematics score and high-school GPA is developed. A portion of Excel output shows the following. ANOVA df Significance F S MS F Regression 1.7621 ? 0.0001 Residual ? ? Total 9 1.88 Coefficient Standard Error t Stat Intercept H_GPA SAT_math -1.4053 0.4848 0.0235 0.0087 ? 0.0049 0.0011 ? where H_GPA = high-school grade point average, SAT_math = SAT mathematics score. (a) (4 points) Complete the eight missing entries (indicated by ?) in the above table. (b) (3 points) At 5% significance level, is the model significant? (c) (3 points) At 5% significance level, is each independent variable significant? (d) (2 points) Did the estimated regression equation provide a good fit to the data? Explain in one or two sentences.
The estimated regression equation relating university GPA to the student's SAT mathematics score and high-school GPA is developed. A portion of Excel output shows the following. ANOVA df Significance F S MS F Regression 1.7621 ? 0.0001 Residual ? ? Total 9 1.88 Coefficient Standard Error t Stat Intercept H_GPA SAT_math -1.4053 0.4848 0.0235 0.0087 ? 0.0049 0.0011 ? where H_GPA = high-school grade point average, SAT_math = SAT mathematics score. (a) (4 points) Complete the eight missing entries (indicated by ?) in the above table. (b) (3 points) At 5% significance level, is the model significant? (c) (3 points) At 5% significance level, is each independent variable significant? (d) (2 points) Did the estimated regression equation provide a good fit to the data? Explain in one or two sentences.

Glencoe Algebra 1, Student Edition, 9780079039897, 0079039898, 2018
18th Edition
ISBN:9780079039897
Author:Carter
Publisher:Carter
Chapter4: Equations Of Linear Functions
Section4.6: Regression And Median-fit Lines
Problem 4GP

Related questions
Question
Transcribed Image Text:The estimated regression equation relating university GPA to the
student's SAT mathematics score and high-school GPA is developed. A
portion of Excel output shows the following.
ANOVA
df
MS
Significance F
Regression
1.7621
?
?
0.0001
Residual
?
Total
1.88
Coefficient
Standard Error
t Stat
Intercept
H_GPA
SAT_math
-1.4053
0.4848
0.0235
0.0087
0.0049
0.0011
where H_GPA = high-school grade point average, SAT_math = SAT
%3D
mathematics score.
(a) (4 points) Complete the eight missing entries (indicated by ?) in
the above table.
(b) (3 points) At 5% significance level, is the model significant?
(c) (3 points) At 5% significance level, is each independent variable
significant?
(d) (2 points) Did the estimated regression equation provide a good
fit to the data? Explain in one or two sentences.
Expert Solution
This question has been solved!
Explore an expertly crafted, step-by-step solution for a thorough understanding of key concepts.

Step by step
Solved in 6 steps with 3 images

Recommended textbooks for you
Glencoe Algebra 1, Student Edition, 9780079039897…
Algebra
ISBN:
9780079039897
Author:
Carter
Publisher:
McGraw Hill
Glencoe Algebra 1, Student Edition, 9780079039897…
Algebra
ISBN:
9780079039897
Author:
Carter
Publisher:
McGraw Hill