MATLAB: An Introduction with Applications
6th Edition
ISBN: 9781119256830
Author: Amos Gilat
Publisher: John Wiley & Sons Inc
expand_more
expand_more
format_list_bulleted
Concept explainers
Question

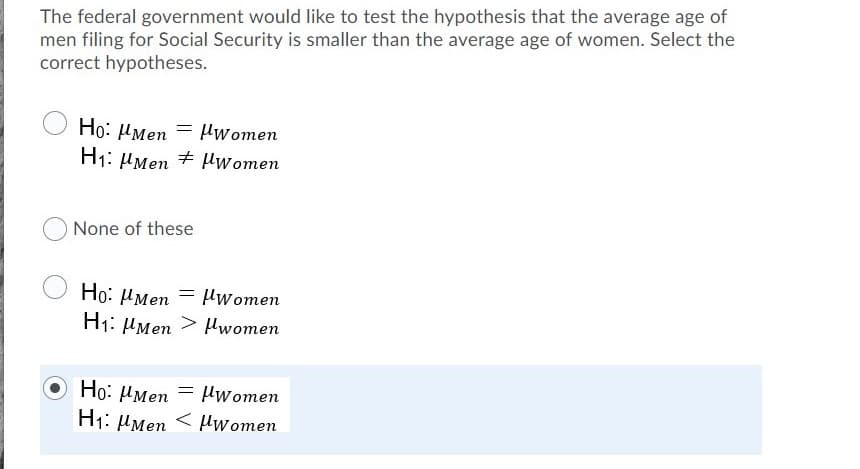
Transcribed Image Text:### Hypothesis Testing Example
The federal government is conducting a study to test a hypothesis concerning the average age of men and women filing for Social Security. The specific hypothesis states that the average age of men filing is smaller than the average age of women. To correctly test this hypothesis, we need to establish our null (H₀) and alternative (H₁) hypotheses.
**Hypotheses Options:**
1. **Option 1:**
- \( H_0: \mu_{Men} = \mu_{Women} \)
- \( H_1: \mu_{Men} \neq \mu_{Women} \)
2. **Option 2:**
- None of these
3. **Option 3:**
- \( H_0: \mu_{Men} = \mu_{Women} \)
- \( H_1: \mu_{Men} > \mu_{Women} \)
4. **Option 4:**
- \( H_0: \mu_{Men} = \mu_{Women} \)
- \( H_1: \mu_{Men} < \mu_{Women} \)
The correct hypotheses for this study are:
- **Null Hypothesis (\( H_0 \))**:
The average age of men filing for Social Security is equal to the average age of women.
\( H_0: \mu_{Men} = \mu_{Women} \)
- **Alternative Hypothesis (\( H_1 \))**:
The average age of men filing for Social Security is smaller than the average age of women.
\( H_1: \mu_{Men} < \mu_{Women} \)
This is represented by Option 4, which is selected.
By establishing these hypotheses, the federal government can conduct appropriate statistical tests to determine if there is sufficient evidence to support the claim that the average age of men filing is indeed smaller than that of women.
Expert Solution

This question has been solved!
Explore an expertly crafted, step-by-step solution for a thorough understanding of key concepts.
This is a popular solution
Trending nowThis is a popular solution!
Step by stepSolved in 2 steps with 2 images

Knowledge Booster
Learn more about
Need a deep-dive on the concept behind this application? Look no further. Learn more about this topic, statistics and related others by exploring similar questions and additional content below.Similar questions
- Suppose you want to test the claim that a population mean equals 38. State the null hypothesis.arrow_forwardA publisher reports that 67% of their readers own a particular make of car. A marketing executive wants to test the claim that the percentage is actually different from the reported percentage. A random sample of 250 found that 62% of the readers owned a particular make of car. State the null and alternative hypotheses. what is HO and HA ?arrow_forwardA survey asked 1578 US residents: “Do you think the use of marijuana should be made legal, or not?”. 61% of respondents said it should be made legal. A newscaster said of this story that “a majority of Americans think marijuana should be legalized”. Use hypothesis testing to see if this newscaster’s statement is justified.arrow_forward
- What does The statistical hypotheses consist of?arrow_forwardA USA Today article claims that the proportion of people who believe global warming is a serious issue is 0.63, but given the number of people you've talked to about this same issue, you believe it is less than 0.63. The hypotheses for this test are Null Hypothesis: p ≥ 0.63, Alternative Hypothesis: p < 0.63. If you randomly sample 20 people and 12 of them believe that global warming is a serious issue, what is your test statistic and p-value? Question 3 options: 1) Test Statistic: 0.278, P-Value: 0.391 2) Test Statistic: 0.278, P-Value: 0.609 3) Test Statistic: -0.278, P-Value: 0.782 4) Test Statistic: -0.278, P-Value: 0.391 5) Test Statistic: -0.278, P-Value: 0.609arrow_forwardSuppose you are asked to conduct a two-tailed hypothesis test on the population mean. What type of hypothesis test would you use? Why? What assumptions do you need to make about the process when you are conducting a hypothesis test on the population mean in order for your results to be valid?arrow_forward
- Consumers Energy states that the average electric bill across the state is $51.28. You want to test the claim that the average bill amount is actually different from $51.28. What are the appropriate hypotheses for this test?arrow_forwardConsumers Energy states that the average electric bill across the state is $60.07. You want to test the claim that the average bill amount is actually greater than $60.07. What are the appropriate hypotheses for this test? Question 12 options: 1) HO: μ ≥ 60.07HA: μ < 60.07 2) HO: μ = 60.07HA: μ ≠ 60.07 3) HO: μ > 60.07HA: μ ≤ 60.07 4) HO: μ ≤ 60.07HA: μ > 60.07 5) HO: μ < 60.07HA: μ ≥ 60.07arrow_forwardBased on information from a large insurance company, 66% of all damage liability claims are made by single people under the age of 25. A random sample of 51 claims showed that 43 were made by single people under the age of 25. Does this indicate that the insurance claims of single people under the age of 25 is higher than the national percent reported by the large insurance company? Give the test statistic and your conclusion.arrow_forward
- A publisher reports that 44% of their readers own a particular make of car. A marketing executive wants to test the claim that the percentage is actually different from the reported percentage. A random sample of 260 found that 40% of the readers owned a particular make of car. State the null and alternative hypotheses.arrow_forwardA publisher reports that 52 % of their readers own a laptop. A marketing executive wants to test the claim that the percentage is actually different from the reported percentage. A random sample of 350 found that 46 % of the readers owned a laptop. State the null and alternative hypotheses.arrow_forwardAccording to a study, approximately 60% of US adults believe that they have achieved, or are within reach of, the "American Dream" (that is, home ownership and financial stability). Now consider a random sample of 400 US adults. What is the probablity that over 65% of the sampled adults believe they have reached or are optimistic about reaching the American Dream? NEED ANSWER! No explanattion pleasearrow_forward
arrow_back_ios
SEE MORE QUESTIONS
arrow_forward_ios
Recommended textbooks for you
- MATLAB: An Introduction with ApplicationsStatisticsISBN:9781119256830Author:Amos GilatPublisher:John Wiley & Sons IncProbability and Statistics for Engineering and th...StatisticsISBN:9781305251809Author:Jay L. DevorePublisher:Cengage LearningStatistics for The Behavioral Sciences (MindTap C...StatisticsISBN:9781305504912Author:Frederick J Gravetter, Larry B. WallnauPublisher:Cengage Learning
- Elementary Statistics: Picturing the World (7th E...StatisticsISBN:9780134683416Author:Ron Larson, Betsy FarberPublisher:PEARSONThe Basic Practice of StatisticsStatisticsISBN:9781319042578Author:David S. Moore, William I. Notz, Michael A. FlignerPublisher:W. H. FreemanIntroduction to the Practice of StatisticsStatisticsISBN:9781319013387Author:David S. Moore, George P. McCabe, Bruce A. CraigPublisher:W. H. Freeman

MATLAB: An Introduction with Applications
Statistics
ISBN:9781119256830
Author:Amos Gilat
Publisher:John Wiley & Sons Inc

Probability and Statistics for Engineering and th...
Statistics
ISBN:9781305251809
Author:Jay L. Devore
Publisher:Cengage Learning

Statistics for The Behavioral Sciences (MindTap C...
Statistics
ISBN:9781305504912
Author:Frederick J Gravetter, Larry B. Wallnau
Publisher:Cengage Learning

Elementary Statistics: Picturing the World (7th E...
Statistics
ISBN:9780134683416
Author:Ron Larson, Betsy Farber
Publisher:PEARSON

The Basic Practice of Statistics
Statistics
ISBN:9781319042578
Author:David S. Moore, William I. Notz, Michael A. Fligner
Publisher:W. H. Freeman

Introduction to the Practice of Statistics
Statistics
ISBN:9781319013387
Author:David S. Moore, George P. McCabe, Bruce A. Craig
Publisher:W. H. Freeman