The figure below is a time-series graph showing overall death rates (from all causes) in a country for 1900 to 2015. The spike in 1919 was due to a worldwide epidemic of influenza. Write a few sentences summarizing the overall trend, describing how much the death rate changed over this period of time and putting the 1919 spike into context terms of its impact on the population. Death Rate per 1000 Population 20 15 10 1900 1910 1920 1930 1940 1950 1960 1970 1980 1990 2000 2010 2020 Year Choose the correct answer below. O A. The death rates have increased by about 30% since the 1920s. The death rate during the influenza epidemic was about half of its current rate. O B. The death rates have decreased by about 50% since the 1920s. The death rate during the influenza epidemic was over four times its current rate. O c. The death rates have decreased by about 50% since the 1920s. The death rate during the influenza epidemic was about half of its current rate. O D. The death rates have decreased by about 30% since the 1920s. The death rate during the influenza epidemic was over twice its current rate.
The figure below is a time-series graph showing overall death rates (from all causes) in a country for 1900 to 2015. The spike in 1919 was due to a worldwide epidemic of influenza. Write a few sentences summarizing the overall trend, describing how much the death rate changed over this period of time and putting the 1919 spike into context terms of its impact on the population. Death Rate per 1000 Population 20 15 10 1900 1910 1920 1930 1940 1950 1960 1970 1980 1990 2000 2010 2020 Year Choose the correct answer below. O A. The death rates have increased by about 30% since the 1920s. The death rate during the influenza epidemic was about half of its current rate. O B. The death rates have decreased by about 50% since the 1920s. The death rate during the influenza epidemic was over four times its current rate. O c. The death rates have decreased by about 50% since the 1920s. The death rate during the influenza epidemic was about half of its current rate. O D. The death rates have decreased by about 30% since the 1920s. The death rate during the influenza epidemic was over twice its current rate.

Algebra & Trigonometry with Analytic Geometry
13th Edition
ISBN:9781133382119
Author:Swokowski
Publisher:Swokowski
Chapter5: Inverse, Exponential, And Logarithmic Functions
Section5.3: The Natural Exponential Function
Problem 40E

Related questions
Question
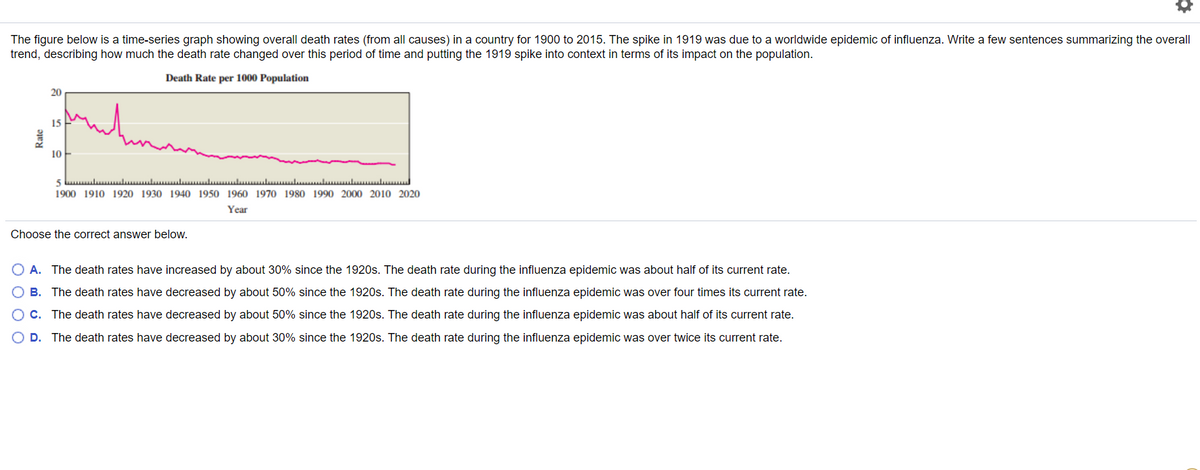
Transcribed Image Text:The figure below is a time-series graph showing overall death rates (from all causes) in a country for 1900 to 2015. The spike in 1919 was due to a worldwide epidemic of influenza. Write a few sentences summarizing the overall
trend, describing how much the death rate changed over this period of time and putting the 1919 spike into context in terms of its impact on the population.
Death Rate per 1000 Population
20
15
10
5 L ul lu luulu l luulul
1900 1910 1920 1930 1940 1950 1960 1970 1980 1990 2000 2010 2020
Year
Choose the correct answer below.
O A. The death rates have increased by about 30% since the 1920s. The death rate during the influenza epidemic was about half of its current rate.
O B. The death rates have decreased by about 50% since the 1920s. The death rate during the influenza epidemic was over four times its current rate.
C. The death rates have decreased by about 50% since the 1920s. The death rate during the influenza epidemic was about half of its current rate.
O D. The death rates have decreased by about 30% since the 1920s. The death rate during the influenza epidemic was over twice its current rate.
Expert Solution
This question has been solved!
Explore an expertly crafted, step-by-step solution for a thorough understanding of key concepts.

This is a popular solution!

Trending now
This is a popular solution!

Step by step
Solved in 2 steps with 1 images

Knowledge Booster


Learn more about
Need a deep-dive on the concept behind this application? Look no further. Learn more about this topic, advanced-math and related others by exploring similar questions and additional content below.Recommended textbooks for you
Algebra & Trigonometry with Analytic Geometry
Algebra
ISBN:
9781133382119
Author:
Swokowski
Publisher:
Cengage


College Algebra (MindTap Course List)
Algebra
ISBN:
9781305652231
Author:
R. David Gustafson, Jeff Hughes
Publisher:
Cengage Learning
Algebra & Trigonometry with Analytic Geometry
Algebra
ISBN:
9781133382119
Author:
Swokowski
Publisher:
Cengage
College Algebra (MindTap Course List)
Algebra
ISBN:
9781305652231
Author:
R. David Gustafson, Jeff Hughes
Publisher:
Cengage Learning

Glencoe Algebra 1, Student Edition, 9780079039897…
Algebra
ISBN:
9780079039897
Author:
Carter
Publisher:
McGraw Hill