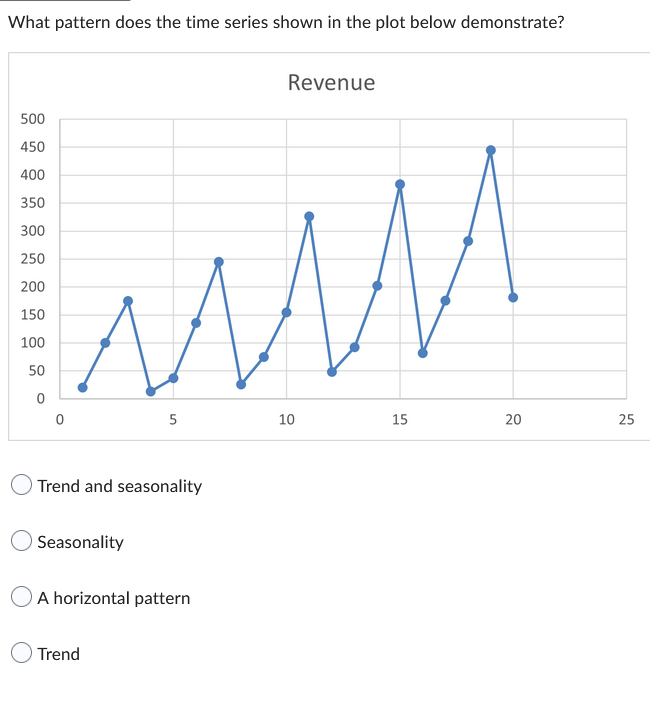
What pattern does the time series shown in the plot below demonstrate? 500 450 400 350 300 250 200 150 100 50 0 A Trend and seasonality Seasonality 5 A horizontal pattern Trend Revenue 10 15 20 25


Q: A population has a mean of 180 and a standard deviation of 24. A sample of 64 observations will be…
A: Given Information: Mean μ=180 Standard deviation σ=24 Sample size n=64
Q: After wearing the patch for 90 minutes, a second pain rating is recorded and the researcher observes…
A:
Q: The body temperatures (in degrees Fahrenheit) have been recorded for a sample of 130 healthy adults…
A: For males : Sample size (n1) = 65Sample mean (x̅1) = 98.394Standard deviations (s1) = 0.743 For…
Q: Refer to the accompanying data set and use the 25 home voltage measurements to construct a frequency…
A: Frequency Distribution The number of occasions a measure did appear in a data source is its…
Q: Which chi-square distribution would be closest to a normal distribution? Multiple Choice
A:
Q: QUESTION 13 "Compared to an independent-measures design, a repeated-measures study is more likely to…
A: Note: Hi! Thank you for your question. As per the guideline we can solve one question at a time in…
Q: The table and scatter plot show the time spent watching TV, x, and the time spent doing homework, y,…
A:
Q: A sampling distribution (dotplot) for the mean quiz score for a sample n = 30 of STAT101 students is…
A: The question is about sampling dist. Given : Sample size ( n ) = 30 To find : 1 ) Sample mean…
Q: An outbreak of gastritis occurred on a cruise ship. The data in the table below were obtained from a…
A: Given that: People who ate food People who did not eat food Food Sick well Sick Well…
Q: For a data set of brain volumes (cm^3) and IQ scores of eight males, the linear correlation…
A: Given n=8, r=0.848
Q: Test the claim about the population variance of at the level of significance a. Assume the…
A: The question is about hypo. testing Given : sample stat : sample var. ( s2 ) = 36.7 Sample size ( n…
Q: A biologist looked at the relationship between number of seeds a plant produces and the percent of…
A:
Q: In the output for a multiple regression model, you have an Adjusted R^2 value of 0.7541. What does…
A: Given: Adjusted R2 value of 0.7541; R2=0.7541
Q: It takes an average of 10 minutes for blood to begin clotting after an injury. An EMT wants to see…
A: Given, population mean,µ = 10 population standard deviation (σ) = 3.5 sample size (n) = 54 sample…
Q: Identify the test statistic for this hypothesis test. The test statistic for this hypothesis test…
A: It is given that Favourable cases, X = 25 Sample size, n = 47 Significance level, α = 0.10 Claim:…
Q: You are given the following payoffs of three acts A1, A2, and A3 and the events E1,E2 and E3. State…
A: The question is about decision theory Given : Prob. of state of nature are 0.1, 0.7 and 0.2 respt.…
Q: Crab spiders hiding on flowers. Refer to the Behavioral Ecology (Jan. 2005) experiment on crab…
A: A. It is needed to test, whether true mean chromatic contrast of crab spiders on daisies is less…
Q: Suppose that X₁, X2, ka)=P(X = _k) =1/2. Let Yn = Xn = n 2 Xi. are independent, such that, for each…
A: Chebyshev's Inequality Chebyshev's inequality guarantees that for a large class of probability…
Q: Listening to Mozart raised non-verbal IQ scores an average of 8 to 9 points higher than listening to…
A: The outcome variable or the dependent variable is the response variable in an experimental study.…
Q: You have found that the effect of IQ on test score can be modelled as a straight line with an…
A: Given, You have found that the effect of IQ on test score can be modelled as a straight line with an…
Q: QUESTION 22 "A clinical psychologist wants to compare the efficacy of medication versus Cognitive…
A: Given that The medicated group (n=22) reports an average of 1.2 suicidal thoughts, with a sample…
Q: Heights (cm) and weights (kg) are measured for 100 randomly selected adult males and range from…
A: Let the independent variable X denote the height Let the dependent variable Y denote the weight The…
Q: For one particular study, suppose a researcher found evidence that at least one of the four group…
A: Here given a evidence of group of means The researcher wishes to keep the probability of making at…
Q: QUESTION 13 "Compared to an independent-measures design, a repeated-measures study is more likely to…
A: Q(13) Hint: We need to know the difference between independent measure study and repeated measure…
Q: Based on the Nielsen ratings, the local CBS affiliate claims its 11 p.m. newscast reaches 41% of the…
A: Given that p = 41% , p^ = 36% , n = 100 Level of significance = 0.10
Q: A company producing cereals of rs a toy in every sixth cereal package in celebration of their 50th…
A:
Q: It is claimed that in a bushel of peaches, fewer than 10% are defective. A sample of 400 peaches is…
A: Let p be the proportion of defectives. It is given that Sample size n = 400 Number of defective, X =…
Q: QUESTION 10 Which of the following statements is true about t distributions? O There are exactly 10…
A: Since you have asked multiple question, we will solve the first question for you. If you want any…
Q: Consider a drug testing company that provides a test for marijuana usage. Among 311 tested…
A:
Q: Zazil’s Instagram reels over the year have averaged around 70 likes per art reel with a standard…
A: According to the above situation, Zazil wants to test if adding trendy music over a reel increases…
Q: Consider a drug that is used to help prevent blood clots in certain patients. In clinical trials,…
A: Given that p = 3% , X = 152 , n = 5794 Level of significance = 0.05
Q: A clinical trial was conducted to test the effectiveness of a drug for treating insomnia in older…
A: Given data mean=98.7 standard deviation=20.9
Q: The 2004 General Social Survey asked a random sample of 977 adult Americans how often they feel…
A: Given datan=977x=304
Q: Carry out a chi-square test for goodness of fit for each of the following studies (use the .01 level…
A: a) In this case, the chi-squared test of goodness of fit is used.
Q: A senior accounting major at Midsouth State University has job offers from four CPA firms. To…
A: The following information has been provided: Analysis of Variance Source df SS MS F p Factor…
Q: Use the sample data and confidence level given below to complete parts (a) through (d). A research…
A: Given,x=520n=918α=1-0.99=0.01α2=0.005Z0.005=2.58
Q: How many ways can the app arrange these ads? ii. How many ways can the app arrange these ads, where…
A: total number of ads are 11 + 5 = 16 i) no. of ways in which these ads are arranged by the app = 16!…
Q: If you have samples of n₁ = 22 and n₂ = 19, in performing the pooled-variance t test, how many…
A: It is given that Sample size of first sample n1 = 22 Sample size of second sample n2 = 19
Q: For each statement, select the correct null hypothesis, H0H0, and alternative hypothesis, HaHa, in…
A:
Q: QUESTION 19 "An independent samples study exhibted the following sample characteristics: Sample 1, n…
A: Given: Sample_1 n1 = 16 Sum of squared deviations SS1 = 293 Sample_2 n2 = 19 Sum of squared…
Q: For a data set of brain volumes (cm3) and IQ scores of eight males, the linear correlation…
A: The p-value for the test statistic is given as 0.231. The objective is to infer if a linear…
Q: A production manager at a wall clock company wants to test their new wall clocks. The designer…
A: Solution: Given information: n= 48 Sample size μ=17 Population mean σ=4 Population standard…
Q: Statistics SA is concerned about the number of professors in statistics. They modelled available…
A: 1.1) The regression model is provided as follows: Y^=1+2X1+5X2-0.1X3 Thus, b0=1b1=2b2=5b3=-0.1
Q: Founola Mode LI 20-30 30-40 40-50 50-60 60-70 70-80 80-90 90-100 £ 5 12 15 20 18 10 6 ५ 3 media…
A: Note: According to Bartleby guidelines expert solve only one question and maximum 3 subpart of the…
Q: a Simde random Sample OP 10 Colleges Freshman were asted How many Hars of sleep They Typically got…
A: * SOLUTION :-
Q: Why is it not possible to have 100% confidence? Explain. Choose the correct answer below. O A. A…
A: Why is it not possible to have 100% confidence? Explain. Choose the correct answer below.A. A 100%…
Q: h of these is a condition for statistical inference when using regression analysis Question 18…
A: The regression analysis has some assumptions like no heteroskedasticity, autocorrelation, and…
Q: QUESTION 26 A independent sample t-test with a df = 15 resulted in an observed (Be sure to round…
A: Given a Independent independent sample t test df=15 Result observes as t=2.95
Q: 9.32 A manufacturing company produces steel housings for electrical equipment. The main component…
A: Solution: Given information: n=49 Sample size Claim: The mean width of the trough is different from…
Q: (a) Suppose 2 = {0, 1,..., 15), A = (0,8), B = {1, 2, 3, 5, 8, 10, 12), C = {0, 4, 9, 15). Determine…
A:
which on is correct?

Step by step
Solved in 3 steps with 3 images

- The elevation of a lake surface (feet above sea level) varies according to the annual flow of a river that feeds it. A geological survey provided the following data from equally spaced intervals of time over a 15 year period. Time Period Elevation 1 4817 2 4819 3 4824 4 4822 5 4826 6 4831 7 4836 8 4837 9 4839 10 4837 11 4832 12 4827 13 4823 14 4818 15 4817 Make a time-series graph displaying the data.The time-series component that exhibits fluctuations over many years above and below the trend is _______. Multiple Choice irregular cycles seasonality autocorrelationcorporate triple-a bond interest rates for 12 consecutive months follow.9.5 9.3 9.4 9.6 9.8 9.7 9.8 10.5 9.9 9.7 9.6 9.6a. construct a time series plot. What type of pattern exists in the data?b. develop three-month and four-month moving averages for this time series. does thethree-month or four-month moving average provide more accurate forecasts basedon MSe? explain.
- The table below contains the average price paid for a new home in a certain area from 2000 to 2010. a. Construct a time-series plot of new home prices. b. What pattern, if any, is present in the data? Year Average_Price_($_thousands)2000 351.12001 330.52002 310.52003 296.72004 229.72005 182.32006 154.52007 156.32008 154.72009 154.52010 154.5Time series plots – Analyze each of these cycle time data separately: C3, C12, C13. That means three different analysis and conclusions. C3 19.98211 20.01223 20.02408 19.94534 19.86814 20.18784 19.92074 20.0778 19.88045 20.08633 19.99881 20.04184 19.7936 19.93159 20.19998 20.18833 20.12368 19.91343 20.1602 20.09396 20.11419 19.9063 20.12964 20.05677 20.19697 19.99937 19.90751 19.96483 20.18774 20.0918 19.9792 20.07172 19.9186 20.08611 20.09117 19.93258 19.99907 19.91208 20.03714 20.12984 20.00285 19.93255 19.9854 19.83015 19.95231 19.91526 20.05989 20.07966 19.97102 19.96757 20.19034 20.4674 20.58558 20.55566 20.42956 20.57294 20.51652 20.51833 20.28469 20.48759 20.54724 20.47618 20.53128 20.31026 20.45437 20.57081 20.53627 20.47538 20.40743 20.61406 20.401 20.44944 20.65229 20.59822 20.36483 20.67807 20.5292 20.57181…corporate triple-a bond interest rates for 12 consecutive months follow.9.5 9.3 9.4 9.6 9.8 9.7 9.8 10.5 9.9 9.7 9.6 9.6a. construct a time series plot. What type of pattern exists in the data?b. develop three-month and four-month moving averages for this time series. does thethree-month or four-month moving average provide more accurate forecasts basedon MSe? explain.c. What is the moving average forecast for the next month?
- A time series is a collection of data that _______. Multiple Choice records past performance records future performance is limited to yearly data is limited to quarterly data#4) Commuter ridership in Athens, Greece, during the summer months is believed to be heavily tied to the number of tourists visiting the city. During the past 12 years, the data are given in the following table. Year Number of Tourists (millions) Ridership (hundreds of thousands) 1 6 11 2 11 16 3 8 16 4 10 14 5 19 28 6 18 26 7 16 21 8 20 25 9 24 45 10 18 28 11 11 18 12 19 35 a) Create a time series plot for the ridership. b) Using linear regression to see if using the year is a good predictor for the ridership. What is the regression equation? How accurate is the model? c) Using linear regression to see if using the number of tourists is a good predictor for the ridership. What is the regression equation? How accurate is the model? d) Which linear regression equation is better? What is the expected ridership if 10 million tourists visit the city next year? e) Excel File16. Recurrent upward and downward movements in a time series are called_________________. a. Secular Trend b. Irregular Variations c. Seasonal Variations d. Cyclical Variations
- A statistical program is recommended. The number of users of a certain website (in millions) from 2004 through 2011 follows. Year Period Users (Millions) 2004 1 1 2005 2 7 2006 3 11 2007 4 57 2008 5 146 2009 6 359 2010 7 609 2011 8 845 (a) Construct a time series plot. A time series plot contains a series of 8 points connected by line segments. The horizontal axis ranges from 0 to 10 and is labeled: Period. The vertical axis ranges from 0 to 900 and is labeled: Millions of Users. The first point is at approximately (1, 850). The rest are plotted from left to right at regular increments of 1 period in a downward, diagonal direction that doesn't appear to become more or less steep as period increases. The last point is at approximately (8, 0). A time series plot contains a series of 8 points connected by line segments. The horizontal axis ranges from 0 to 10 and is labeled: Period. The vertical axis ranges from 0 to 900 and is labeled: Millions of Users.…Describe the following time-series patterns: a. Horizontal Pattern b. Trend Pattern c. Seasonal Pattern d. Cyclical PatternThe Seneca Children’s Fund (SCC) is a local charity that runs a summer camp for disadvantagedchildren. The fund’s board of directors has been working very hard over recentyears to decrease the amount of overhead expenses, a major factor in how charities arerated by independent agencies. The following data show the percentage of the money SCChas raised that was spent on administrative and fund-raising expenses over the last sevenyears. a. Construct a time series plot. What type of pattern exists in the data?b. Use simple linear regression analysis to find the parameters for the line that minimizesMSE for this time series.c. Forecast the percentage of administrative expenses for year 8.d. If SCC can maintain its current trend in reducing administrative expenses, how longwill it take SCC to achieve a level of 5 percent or less?