
Biochemistry
6th Edition
ISBN:9781305577206
Author:Reginald H. Garrett, Charles M. Grisham
Publisher:Reginald H. Garrett, Charles M. Grisham
Chapter27: Metabolic Integration And Organ Specialization
Section: Chapter Questions
Problem 3P

Related questions

Question
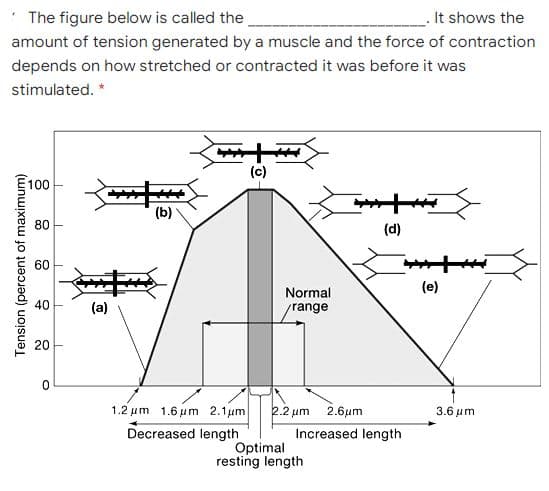
Transcribed Image Text:* The figure below is called the
It shows the
amount of tension generated by a muscle and the force of contraction
depends on how stretched or contracted it was before it was
stimulated. *
100
80
(d)
60
(e)
Normal
/range
40
(a)
20
1.2 μm 1.6 μm 2.1 μm
2.2 um
2.6μm
3.6 μη
Decreased length
Increased length
Optimal
resting length
Tension (percent of maximum)
Expert Solution
This question has been solved!
Explore an expertly crafted, step-by-step solution for a thorough understanding of key concepts.

Step by step
Solved in 2 steps

Knowledge Booster


Learn more about
Need a deep-dive on the concept behind this application? Look no further. Learn more about this topic, biology and related others by exploring similar questions and additional content below.Recommended textbooks for you
Biochemistry
Biochemistry
ISBN:
9781305577206
Author:
Reginald H. Garrett, Charles M. Grisham
Publisher:
Cengage Learning

Human Physiology: From Cells to Systems (MindTap …
Biology
ISBN:
9781285866932
Author:
Lauralee Sherwood
Publisher:
Cengage Learning

Lifetime Physical Fitness & Wellness
Health & Nutrition
ISBN:
9781337677509
Author:
HOEGER
Publisher:
Cengage
Biochemistry
Biochemistry
ISBN:
9781305577206
Author:
Reginald H. Garrett, Charles M. Grisham
Publisher:
Cengage Learning
Human Physiology: From Cells to Systems (MindTap …
Biology
ISBN:
9781285866932
Author:
Lauralee Sherwood
Publisher:
Cengage Learning
Lifetime Physical Fitness & Wellness
Health & Nutrition
ISBN:
9781337677509
Author:
HOEGER
Publisher:
Cengage