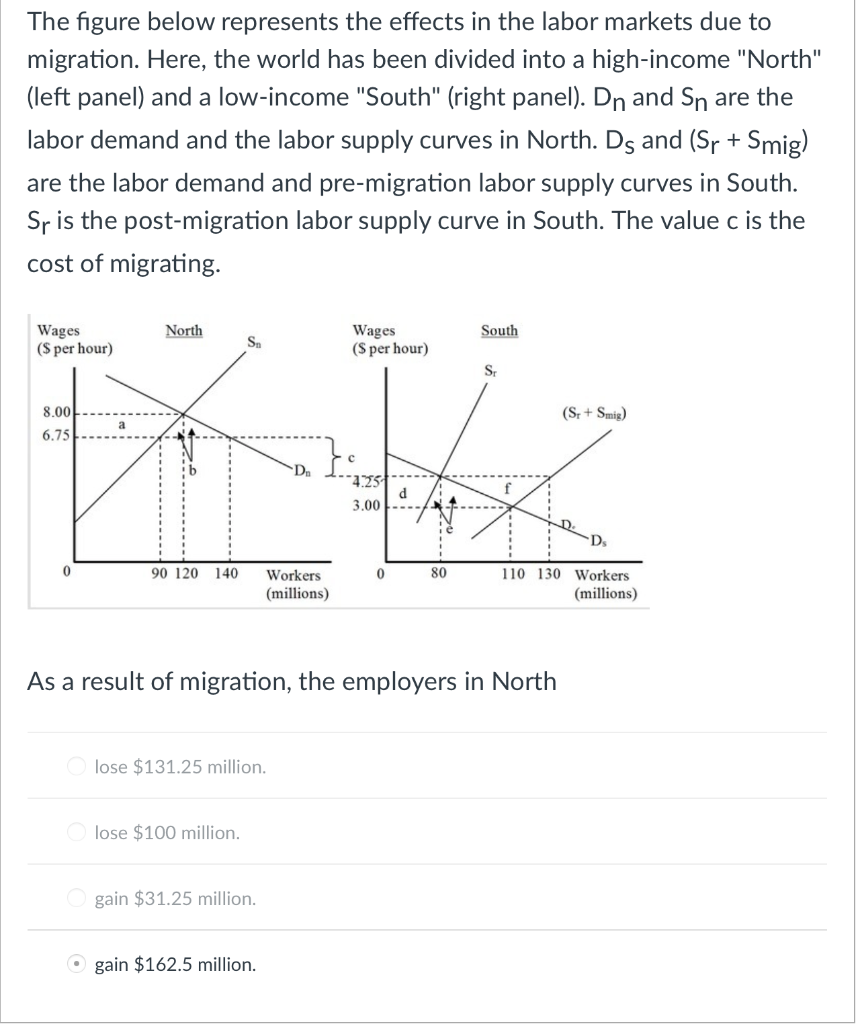
The figure below represents the effects in the labor markets due to migration. Here, the world has been divided into a high-income "North" (left panel) and a low-income "South" (right panel). Dn and Sn are the labor demand and the labor supply curves in North. Ds and (Sr + Smig) are the labor demand and pre-migration labor supply curves in South. Sr is the post-migration labor supply curve in South. The value c is the cost of migrating. Wages (S per hour) North Wages (S per hour) South Sa St 8.00 (S; + Smig) 6.75 `D d 3.00 90 120 140 80 Workers (millions) 110 130 Workers (millions) As a result of migration, the employers in North lose $131.25 million. lose $100 million. gain $31.25 million. O gain $162.5 million.
The figure below represents the effects in the labor markets due to migration. Here, the world has been divided into a high-income "North" (left panel) and a low-income "South" (right panel). Dn and Sn are the labor demand and the labor supply curves in North. Ds and (Sr + Smig) are the labor demand and pre-migration labor supply curves in South. Sr is the post-migration labor supply curve in South. The value c is the cost of migrating. Wages (S per hour) North Wages (S per hour) South Sa St 8.00 (S; + Smig) 6.75 `D d 3.00 90 120 140 80 Workers (millions) 110 130 Workers (millions) As a result of migration, the employers in North lose $131.25 million. lose $100 million. gain $31.25 million. O gain $162.5 million.

Chapter30: The Labor Market
Section: Chapter Questions
Problem 13E

Related questions
Question
5
Transcribed Image Text:The figure below represents the effects in the labor markets due to
migration. Here, the world has been divided into a high-income "North"
(left panel) and a low-income "South" (right panel). Dn and Sn are the
labor demand and the labor supply curves in North. Ds and (Sr + Smig)
are the labor demand and pre-migration labor supply curves in South.
Sr is the post-migration labor supply curve in South. The value c is the
cost of migrating.
North
South
Wages
($ per hour)
Wages
(S per hour)
Sa
8.00
(S: + Smig)
6.75
Dn
-4.75
d
3.00 --.
90 120
140
Workers
80
110 130 Workers
(millions)
(millions)
As a result of migration, the employers in North
O lose $131.25 million.
O lose $100 million.
gain $31.25 million.
O gain $162.5 million.
Expert Solution
This question has been solved!
Explore an expertly crafted, step-by-step solution for a thorough understanding of key concepts.

This is a popular solution!

Trending now
This is a popular solution!

Step by step
Solved in 2 steps

Knowledge Booster


Learn more about
Need a deep-dive on the concept behind this application? Look no further. Learn more about this topic, economics and related others by exploring similar questions and additional content below.Recommended textbooks for you