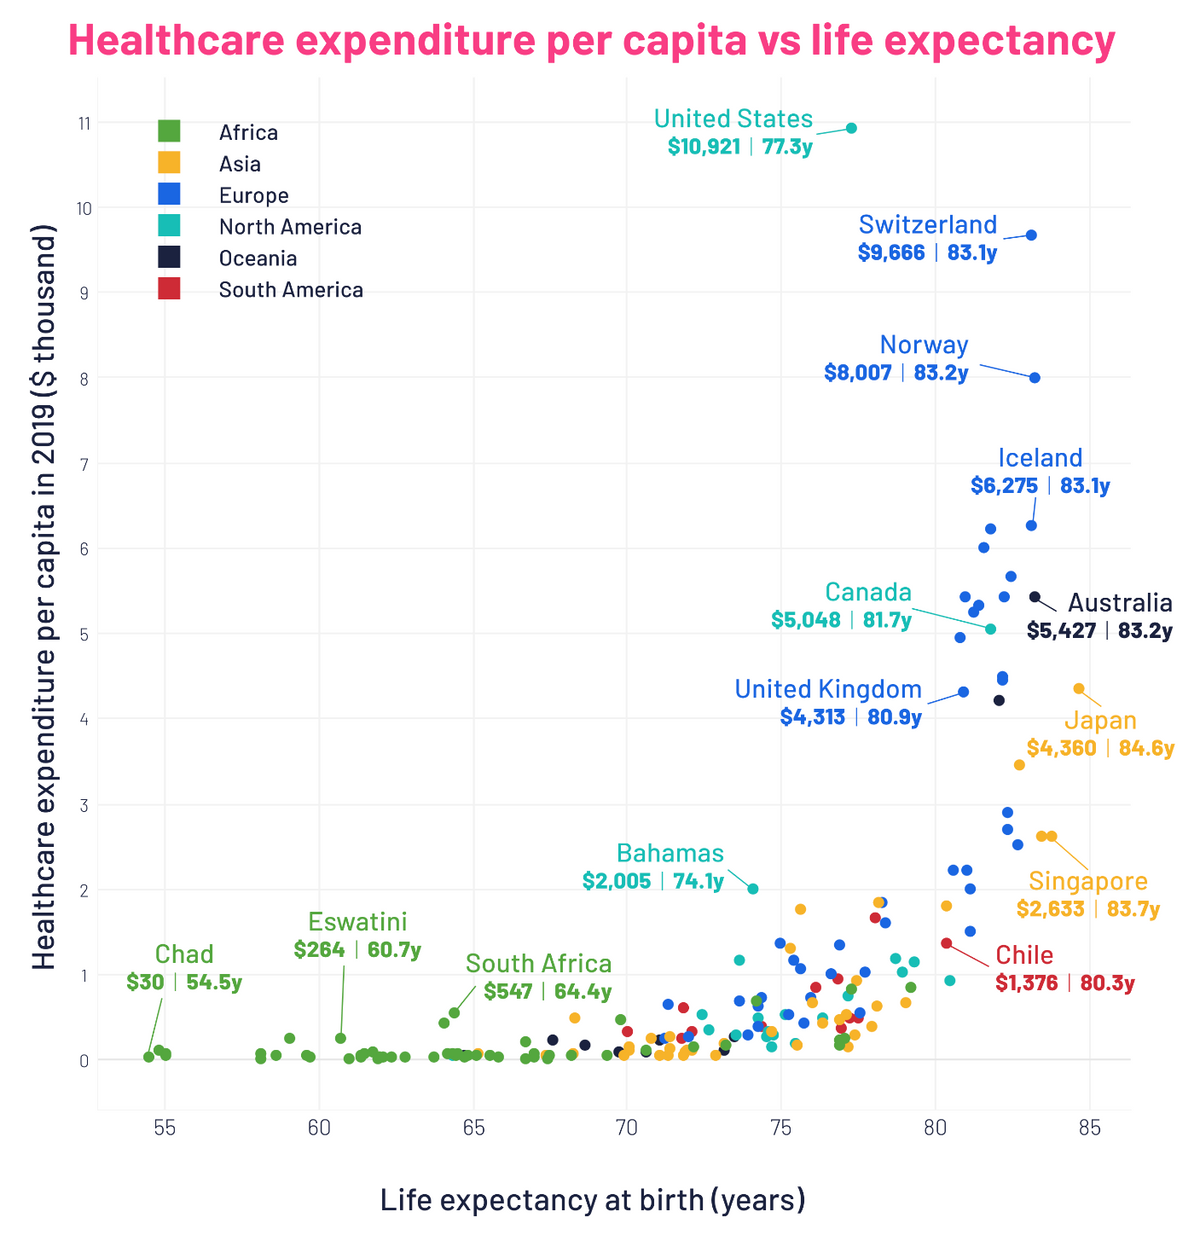
The figure below shows a plot of Healthcare Expenditure per capita in 2019 and Life Expectancy according to data sourced from the World Bank with regions around the world being colour-coded (e.g. Australia, which is in Oceania, has health expenditure per capita of $5,427 and life expectancy of 83.2 years). In no more than 200 words, describe the patterns that you see in this figure.
The figure below shows a plot of Healthcare Expenditure per capita in 2019 and Life Expectancy according to data sourced from the World Bank with regions around the world being colour-coded (e.g. Australia, which is in Oceania, has health expenditure per capita of $5,427 and life expectancy of 83.2 years). In no more than 200 words, describe the patterns that you see in this figure.

Chapter6: Systems Of Equations And Inequalities
Section: Chapter Questions
Problem 17PS: Cholesterol Cholesterol in human blood is necessary, but too much can lead to health problems. There...

Related questions
Question
The figure below shows a plot of Healthcare Expenditure per capita in 2019 and Life Expectancy according to data sourced from the World Bank with regions around the world being colour-coded (e.g. Australia, which is in Oceania, has health expenditure per capita of $5,427 and life expectancy of 83.2 years). In no more than 200 words, describe the patterns that you see in this figure.
Transcribed Image Text:Healthcare expenditure per capita in 2019 ($ thousand)
Healthcare expenditure per capita vs life expectancy
United States
$10,921 | 77.3y
11
10
8
7
2
1
0
Africa
Asia
Europe
North America
Oceania
South America
Chad
$30 54.5y
55
Eswatini
$264 | 60.7y
T
60
Bahamas
$2,005 74.1y
South Africa
$547 64.4y
65
70
Switzerland
$9,666 83.1y
Canada
$5,048 81.7y
75
Norway
$8,007 | 83.2y
United Kingdom
$4,313 80.9y
Life expectancy at birth (years)
80
Iceland
$6,275 83.1y
Australia
$5,427 | 83.2y
Japan
$4,360 84.6y
Singapore
$2,633 83.7y
Chile
$1,376 80.3y
85
Expert Solution
This question has been solved!
Explore an expertly crafted, step-by-step solution for a thorough understanding of key concepts.

Step by step
Solved in 2 steps

Recommended textbooks for you

Functions and Change: A Modeling Approach to Coll…
Algebra
ISBN:
9781337111348
Author:
Bruce Crauder, Benny Evans, Alan Noell
Publisher:
Cengage Learning
Functions and Change: A Modeling Approach to Coll…
Algebra
ISBN:
9781337111348
Author:
Bruce Crauder, Benny Evans, Alan Noell
Publisher:
Cengage Learning