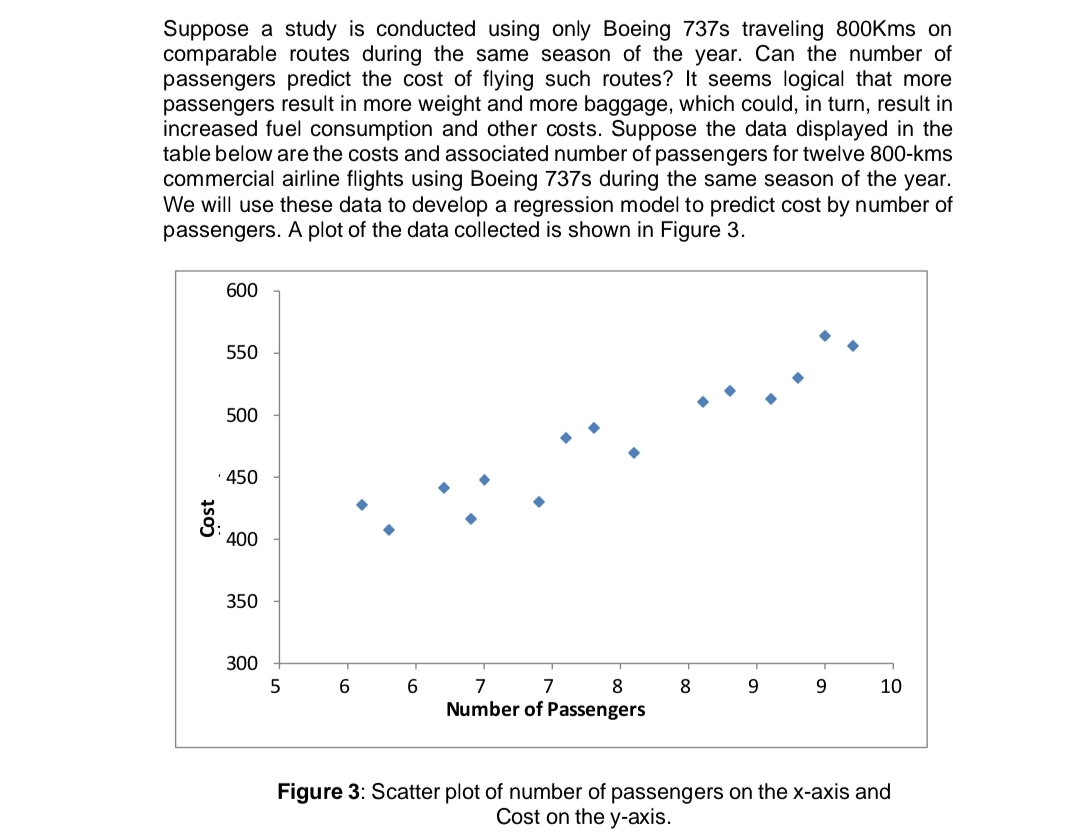
Suppose a study is conducted using only Boeing 737s traveling 800Kms on comparable routes during the same season of the year. Can the number of passengers predict the cost of flying such routes? It seems logical that more passengers result in more weight and more baggage, which could, in turn, result in increased fuel consumption and other costs. Suppose the data displayed in the table below are the costs and associated number of passengers for twelve 800-kms commercial airline flights using Boeing 737s during the same season of the year. We will use these data to develop a regression model to predict cost by number of passengers. A plot of the data collected is shown in Figure 3. 600 550
Suppose a study is conducted using only Boeing 737s traveling 800Kms on comparable routes during the same season of the year. Can the number of passengers predict the cost of flying such routes? It seems logical that more passengers result in more weight and more baggage, which could, in turn, result in increased fuel consumption and other costs. Suppose the data displayed in the table below are the costs and associated number of passengers for twelve 800-kms commercial airline flights using Boeing 737s during the same season of the year. We will use these data to develop a regression model to predict cost by number of passengers. A plot of the data collected is shown in Figure 3. 600 550
MATLAB: An Introduction with Applications
6th Edition
ISBN:9781119256830
Author:Amos Gilat
Publisher:Amos Gilat
Chapter1: Starting With Matlab
Section: Chapter Questions
Problem 1P
Related questions
Question

Transcribed Image Text:Suppose a study is conducted using only Boeing 737s traveling 800Kms on
comparable routes during the same season of the year. Can the number of
passengers predict the cost of flying such routes? It seems logical that more
passengers result in more weight and more baggage, which could, in turn, result in
increased fuel consumption and other costs. Suppose the data displayed in the
table below are the costs and associated number of passengers for twelve 800-kms
commercial airline flights using Boeing 737s during the same season of the year.
We will use these data to develop a regression model to predict cost by number of
passengers. A plot of the data collected is shown in Figure 3.
Cost
600
550
500
450
400
350
300
5
6
6
7
7
8
Number of Passengers
8
9
9
10
Figure 3: Scatter plot of number of passengers on the x-axis and
Cost on the y-axis.

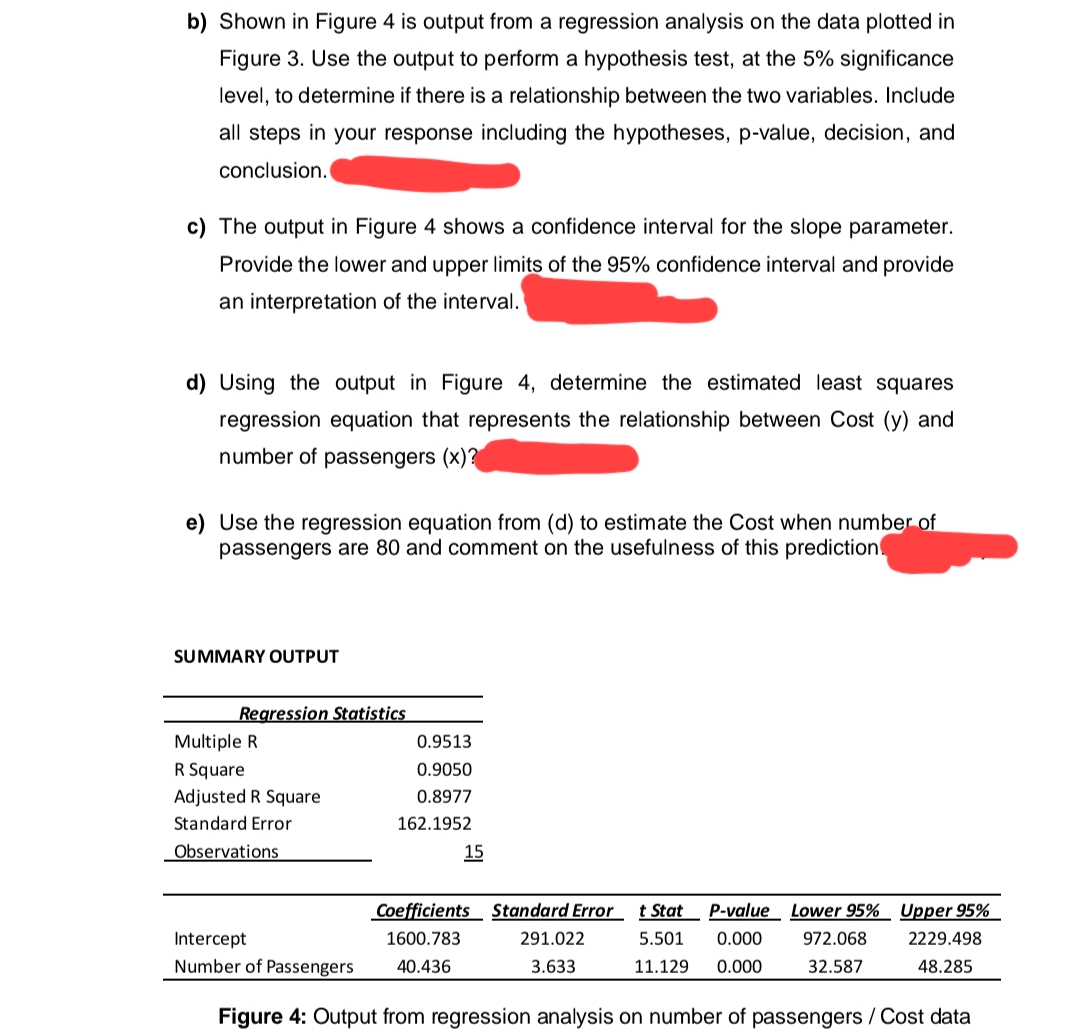
Transcribed Image Text:b) Shown in Figure 4 is output from a regression analysis on the data plotted in
Figure 3. Use the output to perform a hypothesis test, at the 5% significance
level, to determine if there is a relationship between the two variables. Include
all steps in your response including the hypotheses, p-value, decision, and
conclusion.
c) The output in Figure 4 shows a confidence interval for the slope parameter.
Provide the lower and upper limits of the 95% confidence interval and provide
an interpretation of the interval.
d) Using the output in Figure 4, determine the estimated least squares
regression equation that represents the relationship between Cost (y) and
number of passengers (x)?
e) Use the regression equation from (d) to estimate the Cost when number of
passengers are 80 and comment on the usefulness of this prediction
SUMMARY OUTPUT
Regression Statistics
Multiple R
R Square
Adjusted R Square
Standard Error
Observations
0.9513
0.9050
0.8977
162.1952
15
Coefficients Standard Error t Stat P-value Lower 95%
5.501 0.000 972.068
11.129 0.000
1600.783
40.436
32.587
291.022
3.633
Upper 95%
2229.498
48.285
Intercept
Number of Passengers
Figure 4: Output from regression analysis on number of passengers / Cost data
Expert Solution
This question has been solved!
Explore an expertly crafted, step-by-step solution for a thorough understanding of key concepts.
Step by step
Solved in 2 steps

Recommended textbooks for you

MATLAB: An Introduction with Applications
Statistics
ISBN:
9781119256830
Author:
Amos Gilat
Publisher:
John Wiley & Sons Inc

Probability and Statistics for Engineering and th…
Statistics
ISBN:
9781305251809
Author:
Jay L. Devore
Publisher:
Cengage Learning

Statistics for The Behavioral Sciences (MindTap C…
Statistics
ISBN:
9781305504912
Author:
Frederick J Gravetter, Larry B. Wallnau
Publisher:
Cengage Learning

MATLAB: An Introduction with Applications
Statistics
ISBN:
9781119256830
Author:
Amos Gilat
Publisher:
John Wiley & Sons Inc

Probability and Statistics for Engineering and th…
Statistics
ISBN:
9781305251809
Author:
Jay L. Devore
Publisher:
Cengage Learning

Statistics for The Behavioral Sciences (MindTap C…
Statistics
ISBN:
9781305504912
Author:
Frederick J Gravetter, Larry B. Wallnau
Publisher:
Cengage Learning

Elementary Statistics: Picturing the World (7th E…
Statistics
ISBN:
9780134683416
Author:
Ron Larson, Betsy Farber
Publisher:
PEARSON

The Basic Practice of Statistics
Statistics
ISBN:
9781319042578
Author:
David S. Moore, William I. Notz, Michael A. Fligner
Publisher:
W. H. Freeman

Introduction to the Practice of Statistics
Statistics
ISBN:
9781319013387
Author:
David S. Moore, George P. McCabe, Bruce A. Craig
Publisher:
W. H. Freeman