The figure below shows global methane concentrations over time. Use this figure to identify the patterns within the data. CH, mole fraction (ppb) Figure 3-Global Methane Concentrations Over Time 1900 1850 1800 1750 1700 1650 1600 1980 GLOBAL MONTHLY MEAN CH, 1990 2000 YEAR 2010 2020 Which statement best describes the change in methane (CH4) shown in Figure 3? During the years of 1985 to 2015 the concentration of methane in the atmosphere more th doubled. O O The concentration of methane in the atmosphere has increased by approximately 200 ppb from 1985 to 2018. O Methane concentrations have remained relatively stable over the last 30 years. O Every year the concentration of methane increases by the same rate.
The figure below shows global methane concentrations over time. Use this figure to identify the patterns within the data. CH, mole fraction (ppb) Figure 3-Global Methane Concentrations Over Time 1900 1850 1800 1750 1700 1650 1600 1980 GLOBAL MONTHLY MEAN CH, 1990 2000 YEAR 2010 2020 Which statement best describes the change in methane (CH4) shown in Figure 3? During the years of 1985 to 2015 the concentration of methane in the atmosphere more th doubled. O O The concentration of methane in the atmosphere has increased by approximately 200 ppb from 1985 to 2018. O Methane concentrations have remained relatively stable over the last 30 years. O Every year the concentration of methane increases by the same rate.

Applications and Investigations in Earth Science (9th Edition)
9th Edition
ISBN:9780134746241
Author:Edward J. Tarbuck, Frederick K. Lutgens, Dennis G. Tasa
Publisher:Edward J. Tarbuck, Frederick K. Lutgens, Dennis G. Tasa
Chapter1: The Study Of Minerals
Section: Chapter Questions
Problem 1LR

Related questions
Question
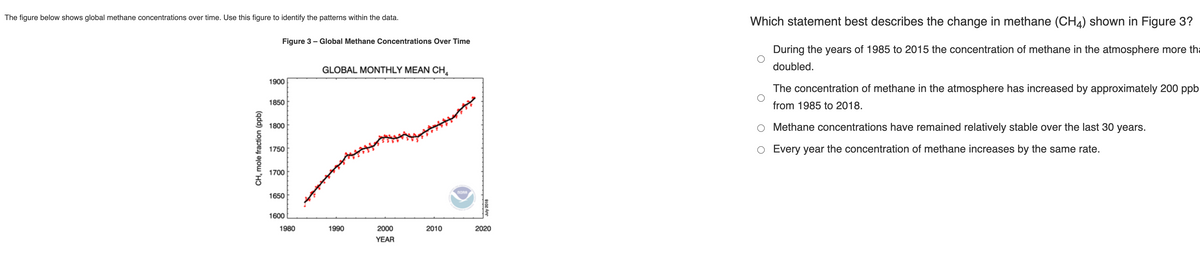
Transcribed Image Text:The figure below shows global methane concentrations over time. Use this figure to identify the patterns within the data.
CH, mole fraction (ppb)
Figure 3 - Global Methane Concentrations Over Time
1900
1850
1800
1750
1700
1650
1600
1980
GLOBAL MONTHLY MEAN CH₁
1990
2000
YEAR
2010
NORA
July 2018
2020
Which statement best describes the change in methane (CH4) shown in Figure 3?
During the years of 1985 to 2015 the concentration of methane in the atmosphere more th
doubled.
The concentration of methane in the atmosphere has increased by approximately 200 ppb
from 1985 to 2018.
Methane concentrations have remained relatively stable over the last 30 years.
Every year the concentration of methane increases by the same rate.
Expert Solution
This question has been solved!
Explore an expertly crafted, step-by-step solution for a thorough understanding of key concepts.

Step by step
Solved in 2 steps with 1 images

Recommended textbooks for you
Applications and Investigations in Earth Science …
Earth Science
ISBN:
9780134746241
Author:
Edward J. Tarbuck, Frederick K. Lutgens, Dennis G. Tasa
Publisher:
PEARSON

Exercises for Weather & Climate (9th Edition)
Earth Science
ISBN:
9780134041360
Author:
Greg Carbone
Publisher:
PEARSON

Environmental Science
Earth Science
ISBN:
9781260153125
Author:
William P Cunningham Prof., Mary Ann Cunningham Professor
Publisher:
McGraw-Hill Education
Applications and Investigations in Earth Science …
Earth Science
ISBN:
9780134746241
Author:
Edward J. Tarbuck, Frederick K. Lutgens, Dennis G. Tasa
Publisher:
PEARSON
Exercises for Weather & Climate (9th Edition)
Earth Science
ISBN:
9780134041360
Author:
Greg Carbone
Publisher:
PEARSON
Environmental Science
Earth Science
ISBN:
9781260153125
Author:
William P Cunningham Prof., Mary Ann Cunningham Professor
Publisher:
McGraw-Hill Education

Earth Science (15th Edition)
Earth Science
ISBN:
9780134543536
Author:
Edward J. Tarbuck, Frederick K. Lutgens, Dennis G. Tasa
Publisher:
PEARSON

Environmental Science (MindTap Course List)
Earth Science
ISBN:
9781337569613
Author:
G. Tyler Miller, Scott Spoolman
Publisher:
Cengage Learning

Physical Geology
Earth Science
ISBN:
9781259916823
Author:
Plummer, Charles C., CARLSON, Diane H., Hammersley, Lisa
Publisher:
Mcgraw-hill Education,