The figure below shows the mass spectrum of octane. Draw the structure of fragment of each peak 100 80 60 40 D 20 F 10 20 30 40 50 60 70 80 90 100 110 m/z Relative Intensity 8-
The figure below shows the mass spectrum of octane. Draw the structure of fragment of each peak 100 80 60 40 D 20 F 10 20 30 40 50 60 70 80 90 100 110 m/z Relative Intensity 8-

Organic Chemistry
8th Edition
ISBN:9781305580350
Author:William H. Brown, Brent L. Iverson, Eric Anslyn, Christopher S. Foote
Publisher:William H. Brown, Brent L. Iverson, Eric Anslyn, Christopher S. Foote
Chapter14: Mass Spectrometry
Section: Chapter Questions
Problem 14.27P: Following is the mass spectrum of an unknown compound. The two highest peaks are at m/z 120 and 122....

Related questions

Question
100%
Answer the graph
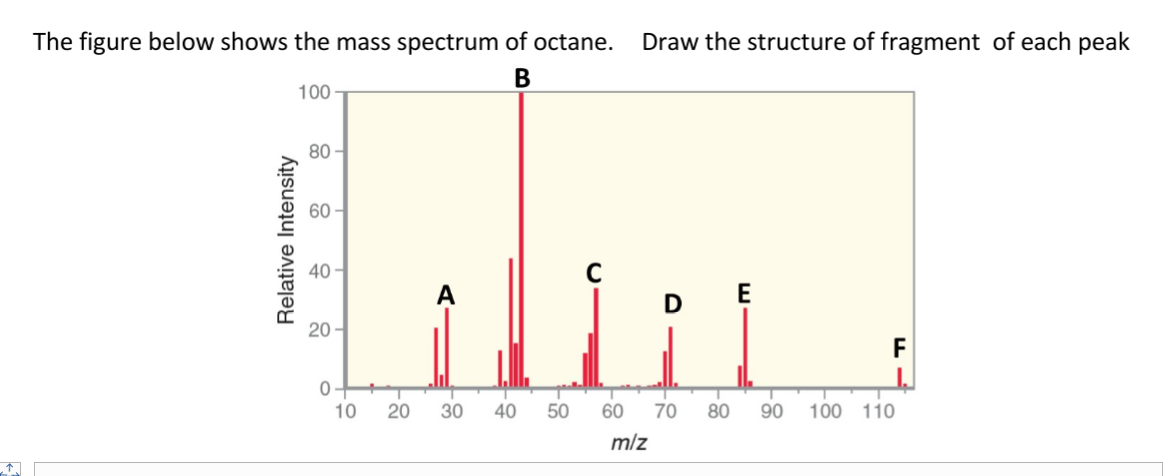
Transcribed Image Text:The figure below shows the mass spectrum of octane.
Draw the structure of fragment of each peak
100
80
60
40
E
20 -
F
10
20
30
40
50
60
70
80
90
100 110
m/z
Relative Intensity
Expert Solution
This question has been solved!
Explore an expertly crafted, step-by-step solution for a thorough understanding of key concepts.

Step by step
Solved in 3 steps with 1 images

Knowledge Booster


Learn more about
Need a deep-dive on the concept behind this application? Look no further. Learn more about this topic, chemistry and related others by exploring similar questions and additional content below.Recommended textbooks for you
Organic Chemistry
Chemistry
ISBN:
9781305580350
Author:
William H. Brown, Brent L. Iverson, Eric Anslyn, Christopher S. Foote
Publisher:
Cengage Learning


Organic Chemistry: A Guided Inquiry
Chemistry
ISBN:
9780618974122
Author:
Andrei Straumanis
Publisher:
Cengage Learning
Organic Chemistry
Chemistry
ISBN:
9781305580350
Author:
William H. Brown, Brent L. Iverson, Eric Anslyn, Christopher S. Foote
Publisher:
Cengage Learning
Organic Chemistry: A Guided Inquiry
Chemistry
ISBN:
9780618974122
Author:
Andrei Straumanis
Publisher:
Cengage Learning