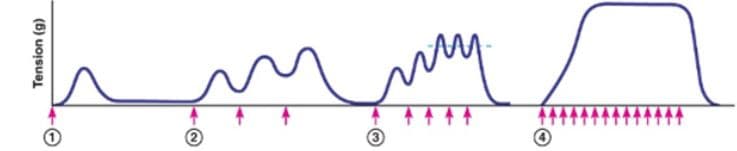
The figure below shows the muscle tension (Y axis) following the application of stimuli to the muscle fiber. The pink arrows on the bottom symbolize stimuli to the muscle cell. The best explanation that the tension of the contraction in panel 4 is larger than other panels is because: A. More motor units are recruited B. More muscles are contracting C. The duration of the stimuli is longer D. The frequency of the stimuli is greater


Musculoskeletal System
The musculoskeletal system, also called the locomotor system, is an organ system that gives humans and animals the ability to move using their muscular and skeletal systems. It provides stability, form, support, and movement to the body. The skeleton is composed of bones (skeleton), muscles, cartilage, tendons, ligaments, joints, and other connective tissue that supports and binds tissues and organs together. The musculoskeletal system is subdivided into two broad systems, such as the muscular system and the skeletal system.
Skeletal structure
The skeletal system is the core framework of the human body. The skeletal structure comprises bones and connective tissue, including cartilage, ligaments, and tendons. The skeletal structure of our body acts as a support structure. It maintains the body's shape and is responsible for its movement, blood cell formation, protection of organs, and mineral storage. The skeletal system is referred to as the musculoskeletal system.
The figure below shows the muscle tension (Y axis) following the application of stimuli to the muscle fiber. The pink arrows on the bottom symbolize stimuli to the muscle cell. The best explanation that the tension of the contraction in panel 4 is larger than other panels is because:

Step by step
Solved in 4 steps


