The figure below shows the probability that a person selected at random has a particular voting intent depending on whether they just watched a negative or positive political ad. Voting intent is a scale of how motivated a person is to go out and vote in an upcoming election with a score of 0 being unlikely, 0.5 being neutral, and a score of 1 being likely. Scores less than 0.5 indicate a tendency to not want to vote, whereas those above 0.5 indicate a tendency to want to vote. How much did positive ads decrease the probability that a random person would want to vote compared to negative ads? Negative ads 0150 a150 0.0 0.044 0.006 -0.3 -0.1 0.1 0.3 0.5 0.7 0.9 1.1 1.3 Voting Intent Positive ads a.191 a191 -0.4 -0.2 0.2 0.4 0.6 0.8 1.0 1.2 Voting Intent 0 s ANSWER < 0.2 C 0.2 SANSWER < 0.4 C 0.4 s ANSWER <0.6 C 0.6 s ANSWER < 0.8 C 0.8 s ANSWER < 1 Probability Density
The figure below shows the probability that a person selected at random has a particular voting intent depending on whether they just watched a negative or positive political ad. Voting intent is a scale of how motivated a person is to go out and vote in an upcoming election with a score of 0 being unlikely, 0.5 being neutral, and a score of 1 being likely. Scores less than 0.5 indicate a tendency to not want to vote, whereas those above 0.5 indicate a tendency to want to vote. How much did positive ads decrease the probability that a random person would want to vote compared to negative ads? Negative ads 0150 a150 0.0 0.044 0.006 -0.3 -0.1 0.1 0.3 0.5 0.7 0.9 1.1 1.3 Voting Intent Positive ads a.191 a191 -0.4 -0.2 0.2 0.4 0.6 0.8 1.0 1.2 Voting Intent 0 s ANSWER < 0.2 C 0.2 SANSWER < 0.4 C 0.4 s ANSWER <0.6 C 0.6 s ANSWER < 0.8 C 0.8 s ANSWER < 1 Probability Density

Chapter8: Sequences, Series,and Probability
Section8.7: Probability
Problem 4ECP: Show that the probability of drawing a club at random from a standard deck of 52 playing cards is...

Related questions
Question
Mm3
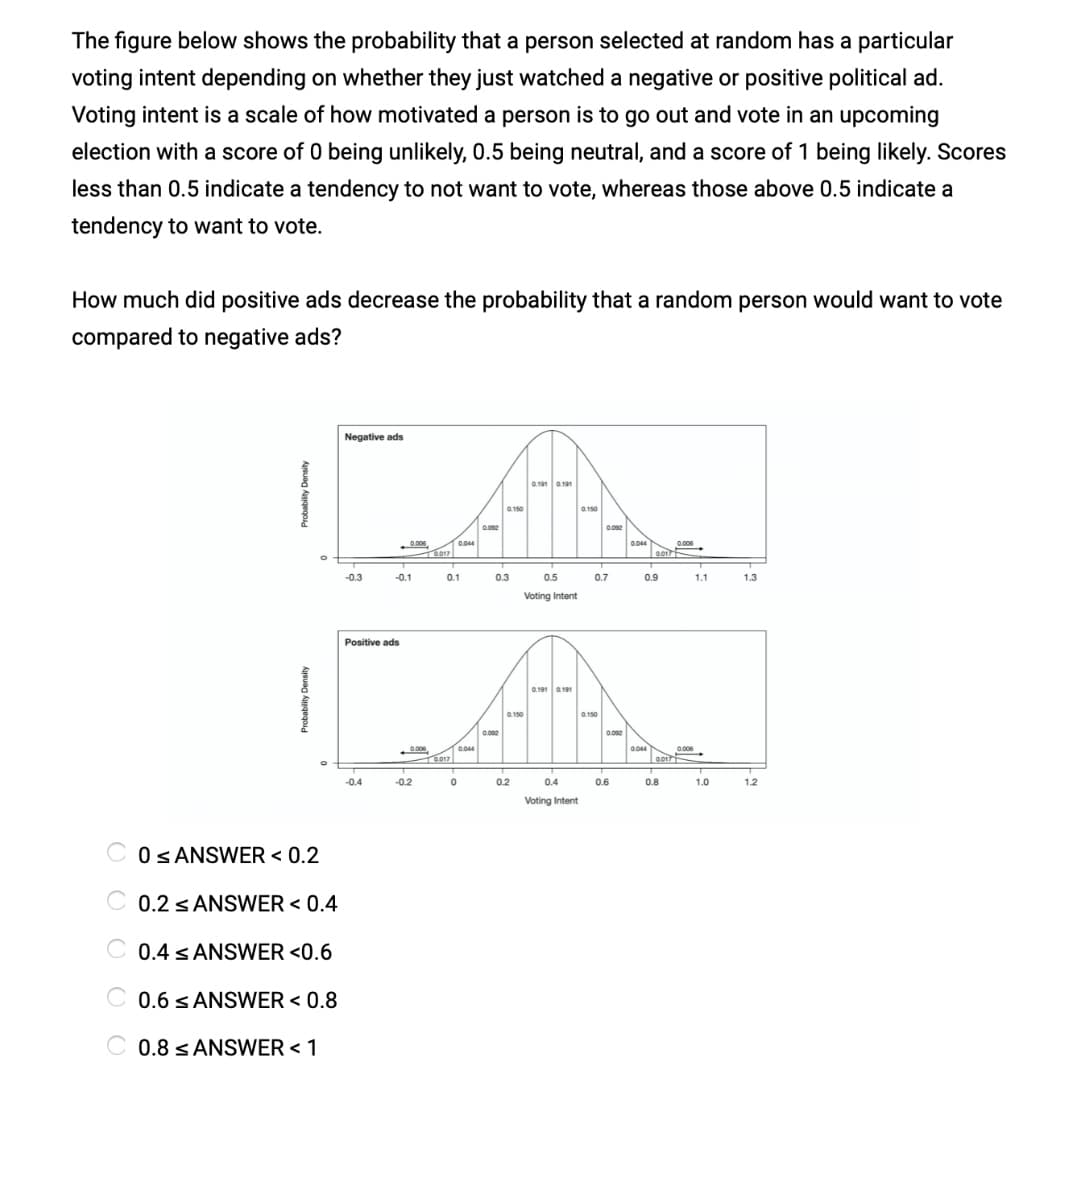
Transcribed Image Text:The figure below shows the probability that a person selected at random has a particular
voting intent depending on whether they just watched a negative or positive political ad.
Voting intent is a scale of how motivated a person is to go out and vote in an upcoming
election with a score of 0 being unlikely, 0.5 being neutral, and a score of 1 being likely. Scores
less than 0.5 indicate a tendency to not want to vote, whereas those above 0.5 indicate a
tendency to want to vote.
How much did positive ads decrease the probability that a random person would want to vote
compared to negative ads?
Negative ads
a.191 a11
a150
a150
0,006
0.044
0.04
0.006
-0.3
-0.1
0.1
0.3
0.5
0.7
0.9
1.1
1.3
Voting Intent
Positive ads
a.191 a191
0.150
0.150
0.002
0,006
-0.4
-0.2
0.2
0.4
0.6
0.8
1.0
1.2
Voting Intent
0 s ANSWER < 0.2
C 0.2 s ANSWER < 0.4
C 0.4 s ANSWER <0.6
C 0.6 SANSWER < 0.8
C 0.8 s ANSWER < 1
O O O O O
robability Density
Probability Density
Expert Solution
This question has been solved!
Explore an expertly crafted, step-by-step solution for a thorough understanding of key concepts.

This is a popular solution!

Trending now
This is a popular solution!

Step by step
Solved in 3 steps

Recommended textbooks for you

Holt Mcdougal Larson Pre-algebra: Student Edition…
Algebra
ISBN:
9780547587776
Author:
HOLT MCDOUGAL
Publisher:
HOLT MCDOUGAL

Holt Mcdougal Larson Pre-algebra: Student Edition…
Algebra
ISBN:
9780547587776
Author:
HOLT MCDOUGAL
Publisher:
HOLT MCDOUGAL