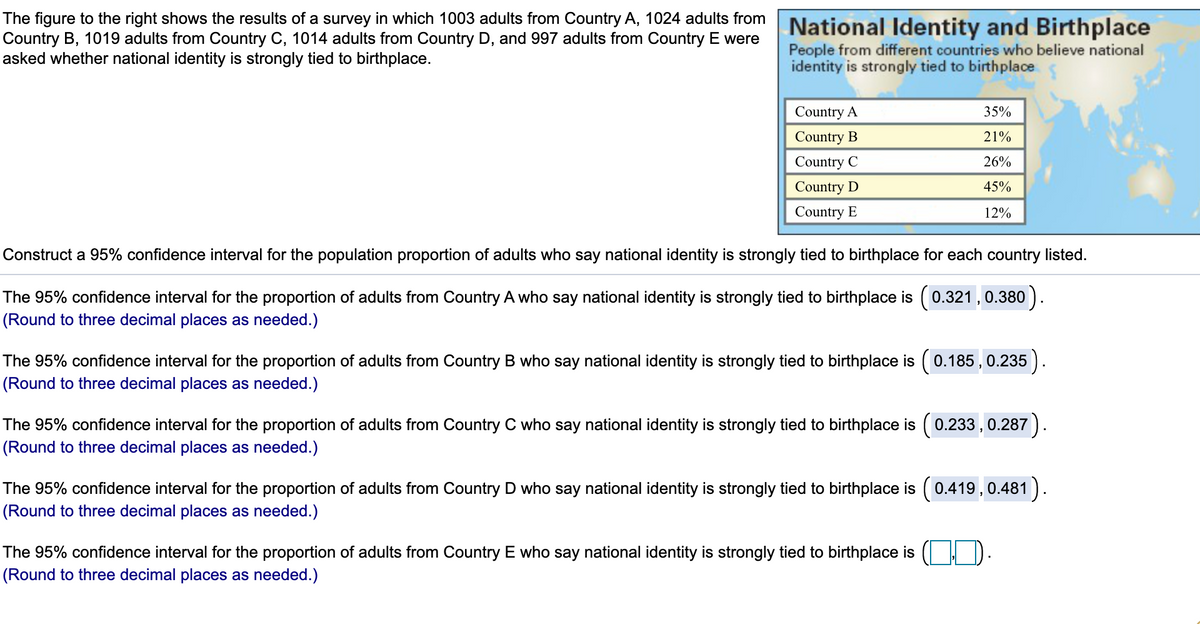
The figure to the right shows the results of a survey in which 1003 adults from Country A, 1024 adults from Country B, 1019 adults from Country C, 1014 adults from Country D, and 997 adults from Country E were asked whether national identity is strongly tied to birthplace. National Identity and Birthplace People from different countries who believe national identity is strongly tied to birthplace Country A 35% Country B 21% Country C 26% Country D 45% Country E 12% Construct a 95% confidence interval for the population proportion of adults who say national identity is strongly tied to birthplace for each country listed. The 95% confidence interval for the proportion of adults from Country A who say national identity is strongly tied to birthplace is (0.321 , 0.380 ). (Round to three decimal places as needed.) The 95% confidence interval for the proportion of adults from Country B who say national identity is strongly tied to birthplace is ( 0.185 , 0.235 ). (Round to three decimal places as needed.) The 95% confidence interval for the proportion of adults from Country C who say national identity is strongly tied to birthplace is ( 0.233 , 0.287 ). (Round to three decimal places as needed.) The 95% confidence interval for the proportion of adults from Country D who say national identity is strongly tied to birthplace is (0.419, 0.481). (Round to three decimal places as needed.) The 95% confidence interval for the proportion of adults from Country E who say national identity is strongly tied to birthplace is ( D. (Round to three decimal places as needed.)


Inverse Normal Distribution
The method used for finding the corresponding z-critical value in a normal distribution using the known probability is said to be an inverse normal distribution. The inverse normal distribution is a continuous probability distribution with a family of two parameters.
Mean, Median, Mode
It is a descriptive summary of a data set. It can be defined by using some of the measures. The central tendencies do not provide information regarding individual data from the dataset. However, they give a summary of the data set. The central tendency or measure of central tendency is a central or typical value for a probability distribution.
Z-Scores
A z-score is a unit of measurement used in statistics to describe the position of a raw score in terms of its distance from the mean, measured with reference to standard deviation from the mean. Z-scores are useful in statistics because they allow comparison between two scores that belong to different normal distributions.


Trending now
This is a popular solution!

Step by step
Solved in 2 steps with 5 images


