The pass completion percentages of 10 college football quarterbacks for their freshman and sophomore seasons are shown in the table below. At a=0.10, is there enough evidence to support the claim that the pass completion percentages changed? Complete parts (a) through (e) below. Player 1 5 6 7 8 9 10 Completion percentage (freshman) 2 3 4 67.9 62.6 56.5 61.0 64.3 50.0 59.0 62.6 54.8 59.5 Completion percentage (sophomorel 67.5 58.6 62.9 62.5 63.2 57.7 64.6 61.6 56.7 61.3 (b) Calculated and sd. Calculate d. d (Round to three decimal places as needed.) Calculate S- $=(Round to three decimal places as needed.) (c) Find the standardized test statistic t t= (Round to two decimal places as needed.) (d) Calculate the P-value. P-value= (Round three decimal places as needed.) (e) The rejection regions for this test would be t< -1.833 and t > 1.833, so the null hypothesis would not be rejected. Decide whether to reject or fail to reject the null hypothesis using the P-value. Interpret the decision the context of the orig claim. Are the results the same as the critical value approach? the results the same as using the critical value approach. the null hypothesis. There enough evidence to the claim that the pass completion percentages have
The pass completion percentages of 10 college football quarterbacks for their freshman and sophomore seasons are shown in the table below. At a=0.10, is there enough evidence to support the claim that the pass completion percentages changed? Complete parts (a) through (e) below. Player 1 5 6 7 8 9 10 Completion percentage (freshman) 2 3 4 67.9 62.6 56.5 61.0 64.3 50.0 59.0 62.6 54.8 59.5 Completion percentage (sophomorel 67.5 58.6 62.9 62.5 63.2 57.7 64.6 61.6 56.7 61.3 (b) Calculated and sd. Calculate d. d (Round to three decimal places as needed.) Calculate S- $=(Round to three decimal places as needed.) (c) Find the standardized test statistic t t= (Round to two decimal places as needed.) (d) Calculate the P-value. P-value= (Round three decimal places as needed.) (e) The rejection regions for this test would be t< -1.833 and t > 1.833, so the null hypothesis would not be rejected. Decide whether to reject or fail to reject the null hypothesis using the P-value. Interpret the decision the context of the orig claim. Are the results the same as the critical value approach? the results the same as using the critical value approach. the null hypothesis. There enough evidence to the claim that the pass completion percentages have

MATLAB: An Introduction with Applications
6th Edition
ISBN:9781119256830
Author:Amos Gilat
Publisher:Amos Gilat
Chapter1: Starting With Matlab
Section: Chapter Questions
Problem 1P

Related questions
Question
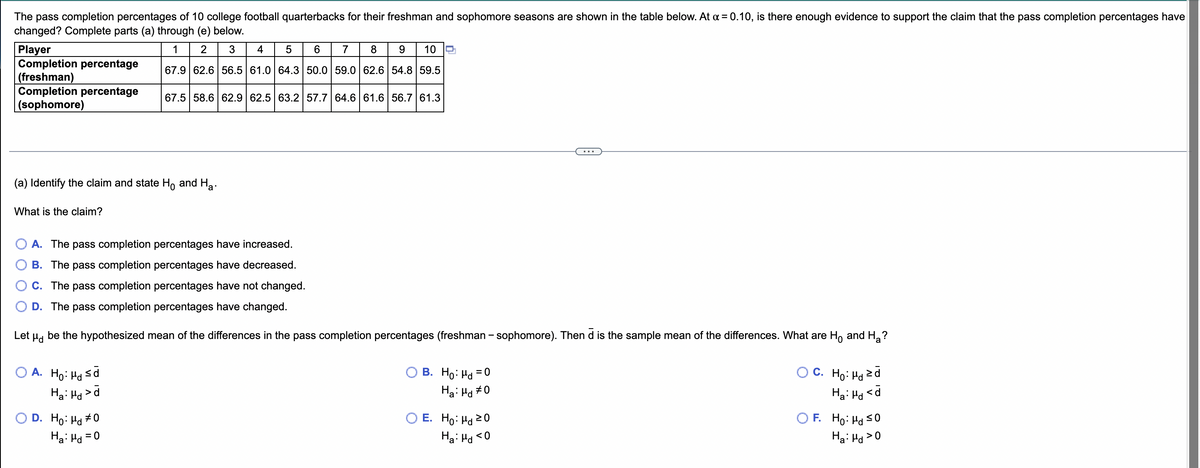
Transcribed Image Text:The pass completion percentages of 10 college football quarterbacks for their freshman and sophomore seasons are shown in the table below. At a = 0.10, is there enough evidence to support the claim that the pass completion percentages have
changed? Complete parts (a) through (e) below.
Player
1
2
3 4
5
6
7
8
9 10
Completion percentage
(freshman)
67.9 62.6 56.5 61.0 64.3 50.0 59.0 62.6 54.8 59.5
Completion percentage
(sophomore)
67.5 58.6 62.9 62.5 63.2 57.7 64.6 61.6 56.7 61.3
(a) Identify the claim and state Ho and H₂.
What is the claim?
A. The pass completion percentages have increased.
B. The pass completion percentages have decreased.
C. The pass completion percentages have not changed.
D. The pass completion percentages have changed.
Let μd be the hypothesized mean of the differences in the pass completion percentages (freshman - sophomore). Then d is the sample mean of the differences. What are Ho and H₂?
B. Ho: Md = 0
A. Ho: Hd ≤d
Ha: Had
C. Ho: zd
Hai Hd <d
>
Ha: Hd #0
D. Ho: Hd #0
O E. Ho: Md 20
OF. Ho: Hd ≤0
Ha: μd=0
Ha: Hd <
<0
Ha: Hd>0
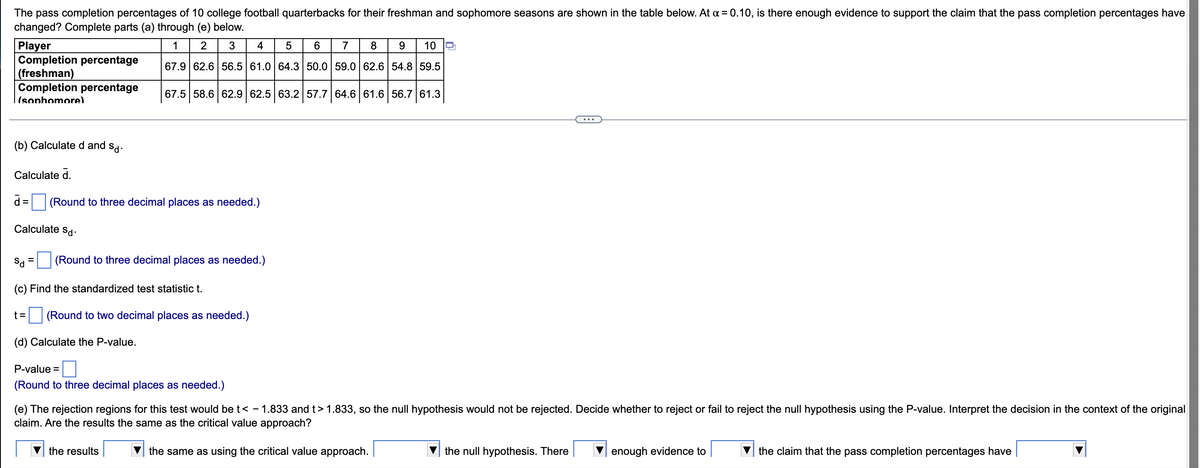
Transcribed Image Text:The pass completion percentages of 10 college football quarterbacks for their freshman and sophomore seasons are shown in the table below. At x = 0.10, is there enough evidence to support the claim that the pass completion percentages have
changed? Complete parts (a) through (e) below.
Player
1
2
3 4
5
6
7
8
9
10
Completion percentage
(freshman)
67.9 62.6 56.5 61.0 64.3 50.0 59.0 62.6 54.8 59.5
Completion percentage
(sophomore)
67.5 58.6 62.9 62.5 63.2 57.7 64.6 61.6 56.7 61.3
(b) Calculated and sd.
Calculate d.
d= (Round to three decimal places as needed.)
Calculate Sd.
=
Sd
(Round to three decimal places as needed.)
(c) Find the standardized test statistic t.
t=
(Round to two decimal places as needed.)
(d) Calculate the P-value.
P-value =
(Round to three decimal places as needed.)
(e) The rejection regions for this test would be t< - 1.833 and t> 1.833, so the null hypothesis would not be rejected. Decide whether to reject or fail to reject the null hypothesis using the P-value. Interpret the decision in the context of the original
claim. Are the results the same as the critical value approach?
the results
the same as using the critical value approach.
the null hypothesis. There
enough evidence to
the claim that the pass completion percentages have
Expert Solution
This question has been solved!
Explore an expertly crafted, step-by-step solution for a thorough understanding of key concepts.

Step by step
Solved in 5 steps with 5 images

Recommended textbooks for you
MATLAB: An Introduction with Applications
Statistics
ISBN:
9781119256830
Author:
Amos Gilat
Publisher:
John Wiley & Sons Inc

Probability and Statistics for Engineering and th…
Statistics
ISBN:
9781305251809
Author:
Jay L. Devore
Publisher:
Cengage Learning

Statistics for The Behavioral Sciences (MindTap C…
Statistics
ISBN:
9781305504912
Author:
Frederick J Gravetter, Larry B. Wallnau
Publisher:
Cengage Learning
MATLAB: An Introduction with Applications
Statistics
ISBN:
9781119256830
Author:
Amos Gilat
Publisher:
John Wiley & Sons Inc
Probability and Statistics for Engineering and th…
Statistics
ISBN:
9781305251809
Author:
Jay L. Devore
Publisher:
Cengage Learning
Statistics for The Behavioral Sciences (MindTap C…
Statistics
ISBN:
9781305504912
Author:
Frederick J Gravetter, Larry B. Wallnau
Publisher:
Cengage Learning

Elementary Statistics: Picturing the World (7th E…
Statistics
ISBN:
9780134683416
Author:
Ron Larson, Betsy Farber
Publisher:
PEARSON

The Basic Practice of Statistics
Statistics
ISBN:
9781319042578
Author:
David S. Moore, William I. Notz, Michael A. Fligner
Publisher:
W. H. Freeman

Introduction to the Practice of Statistics
Statistics
ISBN:
9781319013387
Author:
David S. Moore, George P. McCabe, Bruce A. Craig
Publisher:
W. H. Freeman