The figures for Triple A's revenue and the amount of money earned by wage earners in Albany - NY has been updated in 2020, and shown below: X: Local Payroll ($100,000,000s) Y: Sales ($100,000s) 6.5 8.0 4 8.5 5.5 6. 4.0 9.0 5 a) Create the scatter diagram, similar to Figure 4.1 on page 112. b) Create a table similar to Table 4.2 on page 114 and determine the estimated linear regression equation.
The figures for Triple A's revenue and the amount of money earned by wage earners in Albany - NY has been updated in 2020, and shown below: X: Local Payroll ($100,000,000s) Y: Sales ($100,000s) 6.5 8.0 4 8.5 5.5 6. 4.0 9.0 5 a) Create the scatter diagram, similar to Figure 4.1 on page 112. b) Create a table similar to Table 4.2 on page 114 and determine the estimated linear regression equation.

Holt Mcdougal Larson Pre-algebra: Student Edition 2012
1st Edition
ISBN:9780547587776
Author:HOLT MCDOUGAL
Publisher:HOLT MCDOUGAL
ChapterCSR: Contents Of Student Resources
Section: Chapter Questions
Problem 13.1P

Related questions
Question
B please. Table included
![epubcfi/6/120[%3Bvnd.vst.idref%3DP7001013399000000000000000001F24]!/4/2[P7001013399000000000000000001F24]/44[P70010133... Q
Q A
Table 4.2 Regression Calculations for Triple A Construction
Y
(X – X)
(X-X)(Y - Y)
9.
(3 – 4)² = 1
(3-4) (6– 7) = 1
2
8.
(4 – 4)? = 0
(4 – 4) (8 – 7) = 0
4
2
6.
(6 – 4)² = 4
(6 - 4) (9 – 7) = 4
6.
RENE
(4 – 4)° = 0
2
4
(4 – 4) (5 – 7) = 0
|
4.5
(2 – 4) = 4
(2 – 4) (4.5 – 7) = 5
9.5
(5-4) = 1
(5 – 4) (9.5 – 7) = 2.5
(x-x) (Y - Y) - 12.5
2
E(x-X)(Y-Y
42
ΣΧ
24
BISTR
国
Y = 42/6 = 7
X = 24/6
4
Computing the slope and the intercept of the regression equation for the Triple A Construction Company
example, we have
114
/5
Show
EY Credit Prob 1..pdf
3.
2.](/v2/_next/image?url=https%3A%2F%2Fcontent.bartleby.com%2Fqna-images%2Fquestion%2Ff3041522-3f1c-45f3-aa8a-2daac80a14bf%2F90e6bc09-8fc0-43e8-aa04-8433e40157f5%2Fzo6ylja_processed.jpeg&w=3840&q=75)
Transcribed Image Text:epubcfi/6/120[%3Bvnd.vst.idref%3DP7001013399000000000000000001F24]!/4/2[P7001013399000000000000000001F24]/44[P70010133... Q
Q A
Table 4.2 Regression Calculations for Triple A Construction
Y
(X – X)
(X-X)(Y - Y)
9.
(3 – 4)² = 1
(3-4) (6– 7) = 1
2
8.
(4 – 4)? = 0
(4 – 4) (8 – 7) = 0
4
2
6.
(6 – 4)² = 4
(6 - 4) (9 – 7) = 4
6.
RENE
(4 – 4)° = 0
2
4
(4 – 4) (5 – 7) = 0
|
4.5
(2 – 4) = 4
(2 – 4) (4.5 – 7) = 5
9.5
(5-4) = 1
(5 – 4) (9.5 – 7) = 2.5
(x-x) (Y - Y) - 12.5
2
E(x-X)(Y-Y
42
ΣΧ
24
BISTR
国
Y = 42/6 = 7
X = 24/6
4
Computing the slope and the intercept of the regression equation for the Triple A Construction Company
example, we have
114
/5
Show
EY Credit Prob 1..pdf
3.
2.
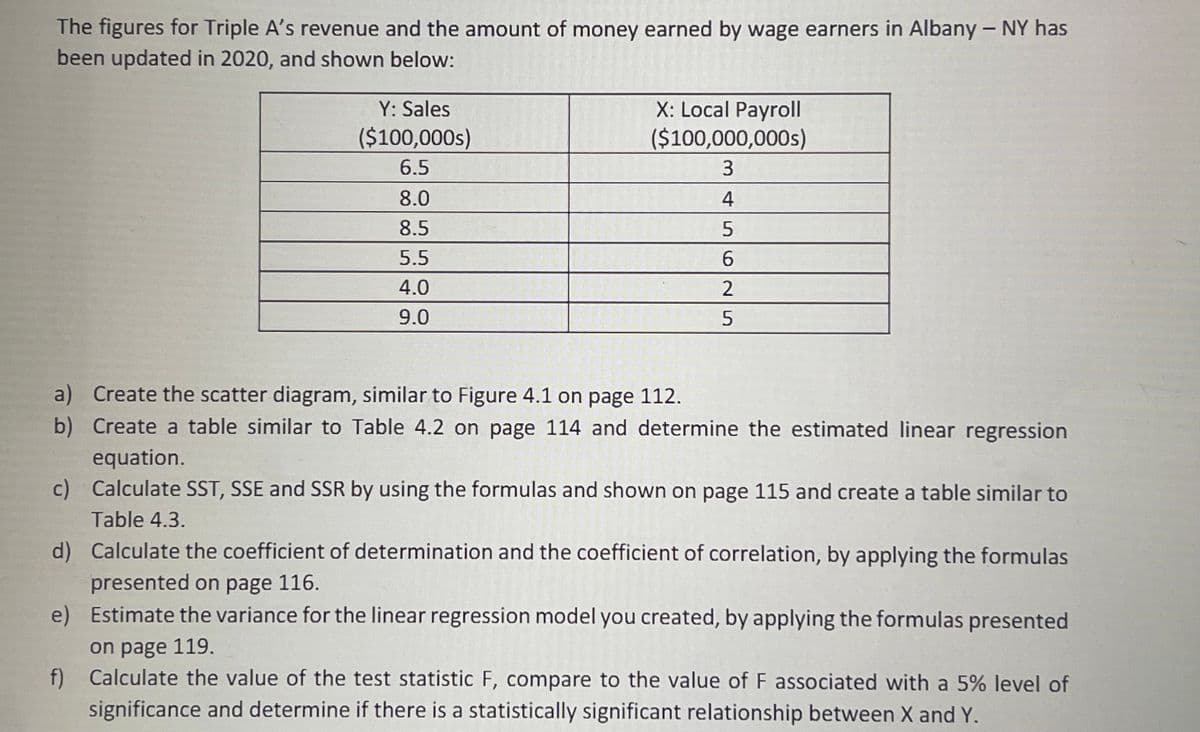
Transcribed Image Text:The figures for Triple A's revenue and the amount of money earned by wage earners in Albany - NY has
been updated in 2020, and shown below:
X: Local Payroll
($100,000,000s)
Y: Sales
($100,000s)
6.5
8.0
4
8.5
5.5
4.0
9.0
a) Create the scatter diagram, similar to Figure 4.1 on page 112.
b) Create a table similar to Table 4.2 on page 114 and determine the estimated linear regression
equation.
c) Calculate SST, SSE and SSR by using the formulas and shown on page 115 and create a table similar to
Table 4.3.
d) Calculate the coefficient of determination and the coefficient of correlation, by applying the formulas
presented on page 116.
e) Estimate the variance for the linear regression model you created, by applying the formulas presented
on page 119.
f) Calculate the value of the test statistic F, compare to the value of F associated with a 5% level of
significance and determine if there is a statistically significant relationship between X and Y.
Expert Solution
This question has been solved!
Explore an expertly crafted, step-by-step solution for a thorough understanding of key concepts.

This is a popular solution!

Trending now
This is a popular solution!

Step by step
Solved in 2 steps

Recommended textbooks for you
Holt Mcdougal Larson Pre-algebra: Student Edition…
Algebra
ISBN:
9780547587776
Author:
HOLT MCDOUGAL
Publisher:
HOLT MCDOUGAL
Holt Mcdougal Larson Pre-algebra: Student Edition…
Algebra
ISBN:
9780547587776
Author:
HOLT MCDOUGAL
Publisher:
HOLT MCDOUGAL