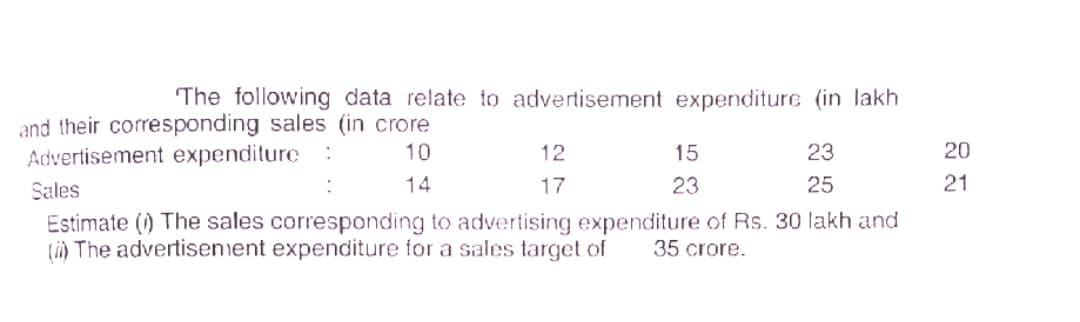
The following data relate to advertisement expenditure (in lakh and their corresponding sales (in crore Advertisement expenditure: 10 12 15 23 20 Sales 14 17 23 25 21 Estimate (1) The sales corresponding to advertising expenditure of Rs. 30 lakh and (i) The advertisenent expenditure for a sales target of 35 crore.


Q: The table below shows monthly data collected on production costs and on the number of units produced…
A: Step 1: We perform regression using the step by step procedure in excel as below: Enter the data…
Q: Table shows the retailed prices and rate of cost of different daily necessary commodities from 1967…
A: Given: Food House rent Cloth Fuel Others Expenditure 25% 20% 20% 10% 25% Price 1967 100…
Q: Consider the following data relating hours spent studying (X) and average grade on course quizzes…
A: Given values are
Q: Consider the following data relating hours spent studying (X) and average grade on course quizzes…
A: The sums are, X Y X2 Y2 XY 5 6 25 36 30 3 8 9 64 24 4 8 16 64 32 7 10 49 100 70 5 7 25…
Q: 7. Calculate the weighted price index from the following data : Quantity required Price during 2014…
A:
Q: Compute SSX
A: The table shows the hours spent studying and the average grade on course quizzes.
Q: From the following data, compute i. Laspeyre’s price index ii. Paasche’s price index Commodity…
A: Commodity Base Commodity Base Current period Current period Price (K) Quantity (Kg) Price (K)…
Q: From the following data compute the price index for 1998 on the basis of 1995 prices. Units of price…
A:
Q: Calculate the seasona! indices by the 'ratio to moving average' method from the fotnowing data. Year…
A:
Q: 2. Compute and interpret r for the following data given: a. age of a person, in years Weight, in kg…
A: 2) age of person, in years 11 12 13 14 15 16 17 18 19 20 Weight, in kg 40 42 38 35 45 51 48…
Q: The cholesterol levels (in milligrams per deciliter) of 30 adults are listed below. Find the…
A: According to the given information, we have Data set:…
Q: Construct index number of price from the following data by applying: 1)Paasche’s method Commodity…
A: Given information: The table of prices and quantities for base year and current year for 4…
Q: Consider the following data relating hours spent studying (X) and average grade on course quizzes…
A:
Q: Estimate the production for 1964 and 1966 from the following data Year 1961 1962 1963 1964 1965 1966…
A:
Q: The data in the following table relate grams plant dry weight (Y) to percent soil organic matter…
A: Matrix multiplication was first described by the French mathematician Jacques Philipe…
Q: From the following data find out (i) purchasing power of money, (ii) real income, and (iii) real…
A:
Q: The data given below relate to the workers in an industrial town. Cost of living index for 1998 upon…
A:
Q: Given the data in Table 2 for Suriname, calculate the following measures for the period 1973-1980.…
A: As per the Bartleby guildlines we have to solve first three subparts and rest can be reposted...…
Q: From the following data, compute Laspeyre’s price index Paasche’s price index
A: The given data with notations can be tabulated as follows:
Q: Given the data below: Year Quarter 1 Quarter 2 Quarter 3 Quarter 4 1 150 140 190 165 2…
A: Given The data is as follows: Year Quarter 1 Quarter 2 Quarter 3 Quarter 4 1 150 140 190 165…
Q: The following table indicates the total number of enrolees of Z-School and the corresponding profit…
A:
Q: The following table shows the annual family income of the students enrolled in the JRMSU-TC and…
A: Solution-: X=Annual family income (Pesos) (in '000) and Y=General weighted average (GPA) %…
Q: 8. From the data given below compute quantity index for 1983. Commodity Quantity in Price in 1982…
A:
Q: Consider the following data relating hours spent studying (X) and average grade on course quizzes…
A:
Q: Consider the following data relating hours spent studying (X) and average grade on course quizzes…
A: In this case, X represent the hours spent is studying and Y represents the average grade on course…
Q: From the following data relating to average prices of a commodity find ( Link relatives (ii) Price…
A:
Q: Calculate the missing values in the following table. Express the answers rounded to two decimal…
A:
Q: For the period 1970-1991 for the United States the following two rival consumption models were…
A: a) The model with the lowest AIC value being considered the ‘best’. From the provided information,…
Q: From the following data compute Laspeyre's Index number for 1998 : Price Quantity Items 1995 . 1998…
A:
Q: Given the following data on the number of pints of ice cream sold at a local ice cream store for a…
A: The moving average method is to be used to find the forecast for time period 11, using the…
Q: From the data given below compute the index number of the food group and ie retail price index…
A:
Q: The data in the following table relate grams plant dry weight (Y) to percent soil organic matter…
A: The linear regression equation is of form Follow the steps below to get the Regression equation…
Q: Prepare index Numbers of price for three years with average price as base from the data given below…
A:
Q: From the data given below, using the simple average of price relative comput: (i) Index number for…
A:
Q: The following data shows the car rental companies and their cars and corresponding income in the…
A: The objective is to find the equation of the regression line for the given data: X Y 63 7 29…
Q: Consider the following data relating hours spent studying (X) and average grade on course quizzes…
A: Given values are
Q: Given below are the data relating to the indices and weights of the consumer's tems for the current…
A:
Q: ompute Marshall – Edgeworth price index number for the following data by taking 2016 as base year.…
A:
Q: Parking is typically an issue for the customers in locating a parking spot and being able to quickly…
A: Given information: Number of vehicles: 350, 350, 350, 400, 400, 400, 400, 400, 450, 450, 450, 450,…
Q: From the following data compute the consumer price Index for the year 1998 w.r.t. the price level of…
A:
Q: Consider the following data for two investments, A and B: Investment A: I = 27 8 = 15 Investment B:…
A: The mean and standard deviation of investment A are 27 and 15, respectively. The mean and standard…
Q: Fit a straight line to the values in below table. i 123456NW X; 10 20 30 40 50 60 70 80 25 70 380…
A:
Q: Number of Sales People Working Daily Sales (in $1000) X=10.4 ỹ =17.6 S =5.64 %3D s, = 5.34
A: We need to determine yesterday’s residual for sales if 18 people were working and sales were…
Q: The U.S. Department of Education and the U.S. Office for Civil Rights track sexual violence…
A: Given table is: The annual data of Sexual Violence Complaints in U.S. Higher Ed for 2009-2016 are as…
Q: Given the following data on the number of pints of ice cream sold at a local ice cream store for a…
A: Given To find forecast demand for period 11 using 2-period moving average,
Q: A) Using the line of best-fit, determine the company’s fixed cost per month and the variable cost…
A: Costs (X) Activity (Y) (x-xbar) (x-xbar)^2 (y-ybar) (y-ybar)^2 (x-xbar)*(y-ybar) 230000 3,500…
Q: Below are the commodity data. Determine (a) Laspeyer's price index and Laspeyer's quantity index.…
A:
Q: Consider the following data relating hours spent studying (X) and average grade on course quizzes…
A: Calculations: From the table, the summary of quantities are,
Q: Consider the following data relating hours spent studying (X) and average grade on course quizzes…
A: The data shows the hours spent studying and average grade on course quizzes.
Q: Table 5.1. Computing a grade point average [R149] Grade Equivalent Quality Grade Point Credits Point…
A: GPA on a 4.0 scale A = 4.0, A- = 3.7, B+ = 3.3, B = 3.0, B- = 2.7, C+ = 2.3, C = 2.0, C- = 1.7, D+ =…

Step by step
Solved in 2 steps

- ABC Company has decided to use 20 test markets to examine the sensitivity of demand for its new product, Hand Sanitizer, to various prices, as shown in the following table. Each market had approximately the same level of business activity and population. Test Market Quantity sold (Thousands of Pens) Price Charged (cent) 1 20 50 2 21 50 3 19 55 4 18 60 5 20 60 6 14 65 7 16 65 8 20 70 9 12 70 10 14 80 11 12 70 12 10 70 13 14 65 14 16 90 15 18 45 16 16 70 17 20 65 18 12 80 19 18 70 20 10 50 Q.1. Using a linear regression model, estimate the demand function for ABC Company’s new product, Hand sanitizer. Q.2. Interpret the coefficient value of the independent variable of the estimated demand function. Q.3. What will be the predicted/estimated sale for each price shown in column 2? Q.4. Find the prediction interval at…An industry trade publication stated that the average profit per customer for this industry was at least $4500. Using a test of hypothesis, do the data support this claim or not Customer Percent Gross Profit Gross Sales Gross Profit Industry Code Competitive Rating* 1 51.0% $170.00 $86.70 1 2 2 32.0% $181.00 $57.92 3 4 3 20.0% $203.00 $40.60 2 2 4 22.0% $249.00 $54.78 5 1 5 21.0% $476.00 $99.96 5 1 6 21.0% $476.00 $99.96 5 4 7 22.0% $635.00 $139.70 2 3 8 34.0% $856.00 $291.04 3 3 9 26.0% $1,062.00 $276.12 4 2 10 16.6% $1,110.00 $183.71 7 3 11 20.0% $1,153.00 $230.60 7 3 12 36.0% $1,392.00 $501.12 4 2 13 18.0% $1,743.00 $313.74 4 2 14 20.0% $2,307.00 $461.40 7 3 15 5.0% $2,534.00 $126.70 4 5 16 29.0% $2,683.00 $778.07 7 2 17 10.0% $2,780.00 $278.00 2 3 18 37.0% $3,272.00 $1,210.64 5 3 19 60.0% $3,864.00 $2,318.40 7 1 20 24.0% $3,988.00 $957.12 6 3 21 9.0% $4,072.00 $366.48 7 3 22 50.0% $4,190.00 $2,095.00 5 3 23 17.0% $4,219.00 $717.23 3…In a particularly small region in the Philippines, the consumer price index C depends on
- Kaitlyn measures the upload speed in megabits per second of her home broadband internet connection during peak hours and off-peak hours. The results are provided in the accompanying table. Peak Off-Peak 5.83 5.14 6.05 6.80 7.14 6.98 3.54 5.77 5.45 7.27 5.90 6.62 5.81 6.19 4.82 6.08 6.37 6.59 4.65 5.58 5.30 7.41 6.48 6.26 5.96 6.37 5.79 6.31 6.84 6.55 5.06 4.95 5.61 7.03 6.45 6.77 Examine the results of Kaitlyn's test to determine the statements that compare the medians and interquartile ranges of the data sets to each other in terms of this situation. Select the two correct answers. The median upload speed during peak hours is 5.905 megabits per second, which is less than the median upload speed during off-peak hours, 7.005 megabits per second. The upload speeds during peak hours are slower on average compared to off-peak times. The median upload speed during peak hours is 6.37 megabits per second, which is greater than the median upload speed during…The following table cross-classifies pregnant women in the study by their body mass index (BMI) at 16 weeks gestation and whether they had pre-term delivery. What proportion of women with BMI greater than 35 delivers pre-term? BMI < 30 BMI 30–34.9 BMI 35+ Pre-term 320 80 120 Full term 4700 480 300 A)0.0867 B)0.2857 C)0.0533 D)0.533A mining company finds that daily lost-work injuries averages to 1.2. If the local union contract has a clause requiring that the mine be shut down as soon as three workers incur lost-work injuries, on what percentage of the days will the mine be operational throughout the day?