The first graph depicts the industry supply and demand for yoga classes. Assume that the market is initially in equilibrium at the intersection of lines D and S. The second graph is the cost information for a single firm in this perfectly competitive industry. Assume there is an increase in the industry demand for yoga classes and the industry demand curve moves from D to D1. Furthermore, assume this is a constant cost industry. Shift the supply (S) curve to the correct positions to reflect long-run equilibrium in this constant cost industry. Next, use the interactive line to trace out the long-run industry supply curve (LRIS) for this industry. Price per class Yoga Industry Supply and Demand Short-run marginal cost Long-run average cost Short-run average cost S Price=Marginal revenue DRIS DI Quantity of classes D Quantity of classes Price ($)
The first graph depicts the industry supply and demand for yoga classes. Assume that the market is initially in equilibrium at the intersection of lines D and S. The second graph is the cost information for a single firm in this perfectly competitive industry. Assume there is an increase in the industry demand for yoga classes and the industry demand curve moves from D to D1. Furthermore, assume this is a constant cost industry. Shift the supply (S) curve to the correct positions to reflect long-run equilibrium in this constant cost industry. Next, use the interactive line to trace out the long-run industry supply curve (LRIS) for this industry. Price per class Yoga Industry Supply and Demand Short-run marginal cost Long-run average cost Short-run average cost S Price=Marginal revenue DRIS DI Quantity of classes D Quantity of classes Price ($)

Chapter12: The Partial Equilibrium Competitive Model
Section: Chapter Questions
Problem 12.4P

Related questions
Question
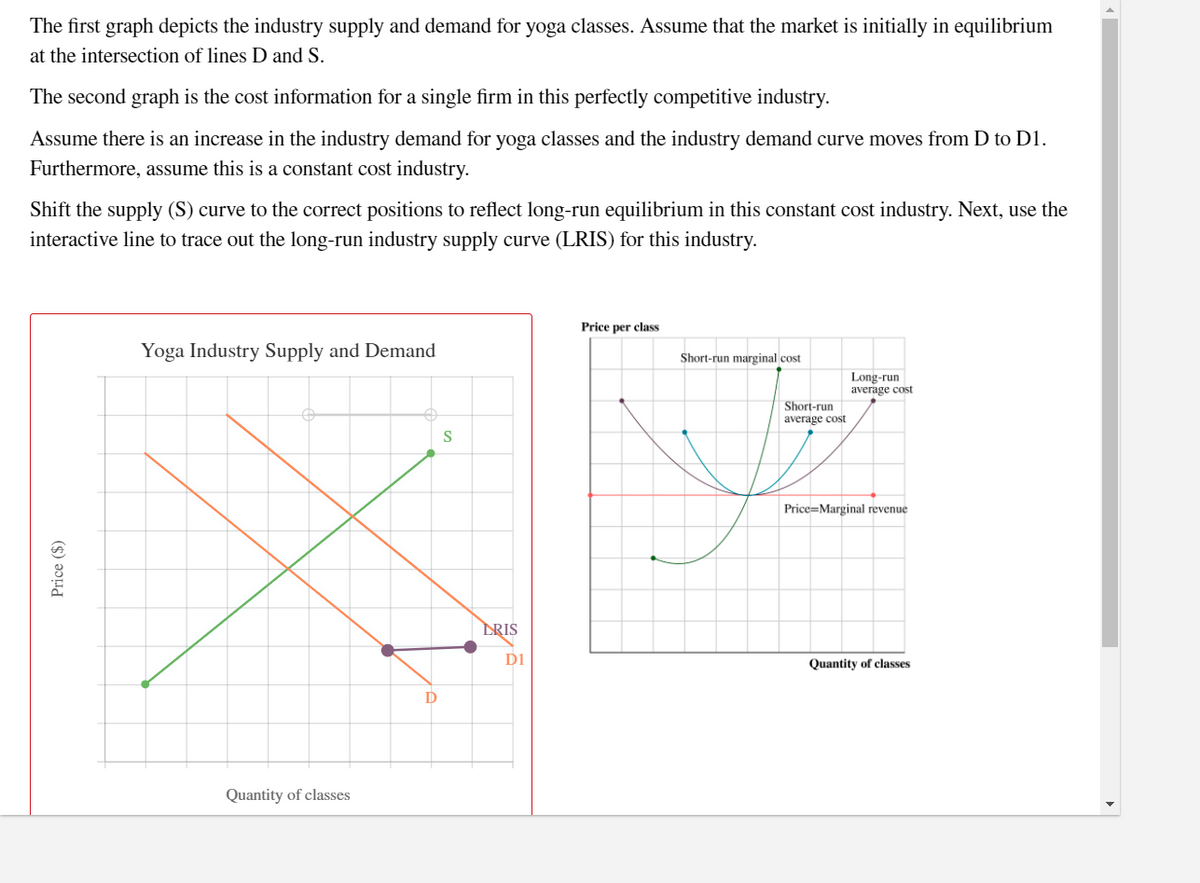
Transcribed Image Text:The first graph depicts the industry supply and demand for yoga classes. Assume that the market is initially in equilibrium
at the intersection of lines D and S.
The second graph is the cost information for a single firm in this perfectly competitive industry.
Assume there is an increase in the industry demand for yoga classes and the industry demand curve moves from D to D1.
Furthermore, assume this is a constant cost industry.
Shift the supply (S) curve to the correct positions to reflect long-run equilibrium in this constant cost industry. Next, use the
interactive line to trace out the long-run industry supply curve (LRIS) for this industry.
Price per class
Yoga Industry Supply and Demand
Short-run marginal cost
Long-run
average cost
Short-run
average cost
S
Price=Marginal revenue
DRIS
D1
Quantity of classes
Quantity of classes
Price ($)
Expert Solution
This question has been solved!
Explore an expertly crafted, step-by-step solution for a thorough understanding of key concepts.

This is a popular solution!

Trending now
This is a popular solution!

Step by step
Solved in 3 steps with 4 images

Knowledge Booster


Learn more about
Need a deep-dive on the concept behind this application? Look no further. Learn more about this topic, economics and related others by exploring similar questions and additional content below.Recommended textbooks for you

Economics (MindTap Course List)
Economics
ISBN:
9781337617383
Author:
Roger A. Arnold
Publisher:
Cengage Learning

Economics (MindTap Course List)
Economics
ISBN:
9781337617383
Author:
Roger A. Arnold
Publisher:
Cengage Learning
