The Fish and Game Department stocked a lake with fish in the following proportions: 30% catfish, 15% bass, 40% bluegill, and 15% pike. Five years later it sampled the lake to see if the distribution of fish had changed. It found that the 500 fish in the sample were distributed as follows. In the 5-year interval, did the distribution of fish change at the 0.05 level? (a) What is the level of significance? o os State the null and alternate hypotheses. H The debutons aeaert Hy The dabuton weae A The debutions ahe same Hy The datibutions ae difrent The detbutons hesame Hy The dabuton wheae M The d onsaert Hy The dunbutans earet (b) Find the value of the chi-square statistic for the sample. (Round the expected frequencies to at least three decimal places. Round the test statistic to three decimal places.) Are all the expected frequencies greater than 5? What sampling distribution will you use? unfom binomial Shudenta nomal e What are the degrees of freedom? (c) Estimate the P-value of the sample test statistic.
The Fish and Game Department stocked a lake with fish in the following proportions: 30% catfish, 15% bass, 40% bluegill, and 15% pike. Five years later it sampled the lake to see if the distribution of fish had changed. It found that the 500 fish in the sample were distributed as follows. In the 5-year interval, did the distribution of fish change at the 0.05 level? (a) What is the level of significance? o os State the null and alternate hypotheses. H The debutons aeaert Hy The dabuton weae A The debutions ahe same Hy The datibutions ae difrent The detbutons hesame Hy The dabuton wheae M The d onsaert Hy The dunbutans earet (b) Find the value of the chi-square statistic for the sample. (Round the expected frequencies to at least three decimal places. Round the test statistic to three decimal places.) Are all the expected frequencies greater than 5? What sampling distribution will you use? unfom binomial Shudenta nomal e What are the degrees of freedom? (c) Estimate the P-value of the sample test statistic.

Glencoe Algebra 1, Student Edition, 9780079039897, 0079039898, 2018
18th Edition
ISBN:9780079039897
Author:Carter
Publisher:Carter
Chapter10: Statistics
Section10.4: Distributions Of Data
Problem 19PFA

Related questions
Question
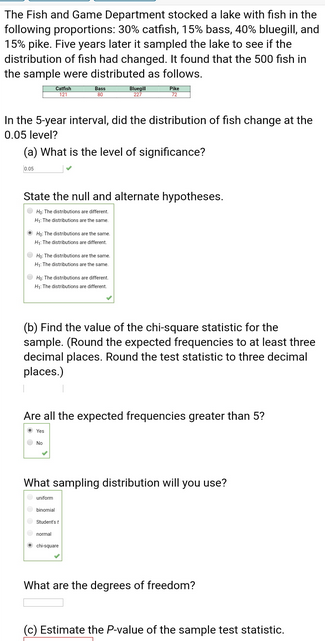
Transcribed Image Text:The Fish and Game Department stocked a lake with fish in the
following proportions: 30% catfish, 15% bass, 40% bluegill, and
15% pike. Five years later it sampled the lake to see if the
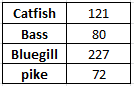
distribution of fish had changed. It found that the 500 fish in
the sample were distributed as follows.
In the 5-year interval, did the distribution of fish change at the
0.05 level?
(a) What is the level of significance?
o os
State the null and alternate hypotheses.
H The debutons aeaert
Hy The dabuton weae
A The debutions ahe same
Hy The datibutions ae difrent
The detbutons hesame
Hy The dabuton wheae
M The d onsaert
Hy The dunbutans earet
(b) Find the value of the chi-square statistic for the
sample. (Round the expected frequencies to at least three
decimal places. Round the test statistic to three decimal
places.)
Are all the expected frequencies greater than 5?
What sampling distribution will you use?
unfom
binomial
Shudenta
nomal
e
What are the degrees of freedom?
(c) Estimate the P-value of the sample test statistic.
Expert Solution
Step 1
The question is about categorical data analysis
Given :
Prop. of catfish ( p1 ) = 30 % = 0.30
Prop. of Bass ( p2 ) = 15 % = 0.15
Prop. of Bluegill ( p3 ) = 40 % = 0.40
Prop. of pike ( p4 ) = 15 % = 0.15
Level of signif. ( ) = 0.05
To find :
a ) value of level of signif. and null and alt. hypo
b ) Test stat
c ) p value
d ) conclusion

Step by step
Solved in 2 steps with 3 images

Recommended textbooks for you
Glencoe Algebra 1, Student Edition, 9780079039897…
Algebra
ISBN:
9780079039897
Author:
Carter
Publisher:
McGraw Hill
Glencoe Algebra 1, Student Edition, 9780079039897…
Algebra
ISBN:
9780079039897
Author:
Carter
Publisher:
McGraw Hill