Using the information in the screenshot, can you please determine if there is any outliers and why?
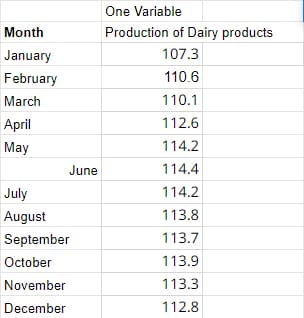
Q: A jar contains 7 poker chips: 4 blue, 2 red and 1 white. You randomly select two chips from the jar.…
A: Given,no.of blue chips(b)=4no.of red chips(r)=2no.of white chips(w)=1Total no.of chips=7
Q: You are the administrator of a government agency. You have collected for a random sample of 51…
A: A random sample of 51 households of 4 people having data concerning the monthly household food…
Q: Concerns about climate change.and CO2 reduction have initiated the commercial production of blends…
A: The mean is 0.9340 and the standard deviation is 0.0020.
Q: 1. Consider the monthly sales data given in Table 1. Month Sales (in thousands) Jan Feb Mar Apr May…
A: Note: As per the guidelines, in case of multiple questions answer to first question will be…
Q: PLEASE I NEED HELP WITH THIS. (Please dont make it longer than 30 minutes I really need help.)…
A: The correlation coefficient is computed between the 2 variables x and y Day's temp x Night's…
Q: (a) State the null and alternative hypotheses and use sign test to find a P value relevant to the…
A: The data is given on the results of the examination before and after the course. Sample size (n) =…
Q: Obtain the correlation. Provide your answer to four decimal place.
A: The Pew Research Centre conducted an international survey to explore relationship between the level…
Q: In a sample of 100 steel wires the average breaking strength is 50 kN, with a standard deviation of…
A: Hi! Thank you for the question. As per the honor code, we are allowed to answer three sub-parts at a…
Q: The diastolic blood pressures for a sample of patients at a clinic were as follows. The measurements…
A: Data given 78 87 91 85 97 102 73 90 102 105 94 85 81 95 77 106 84 101 83 92 79 81 96 88 100 85 89 87…
Q: What is the essential component of a well designed experiment
A: Given information: A well-designed experiment
Q: How can I read this correlation matrix-
A: Given that, Sample size (n) = 30 The variables used are Price, size, township, and years. The…
Q: In 2004 it surfaced in Reader's Digest presented as having unnamed community college. Four students…
A: Given The number of students who walked halfway through the history test =4 The total number of…
Q: In your calculus class, your final grade is based on four categories. The categories are tests,…
A: Hey there! Thank you for posting the question. Since there are multiple questions posted, we will…
Q: On the right are the amounts (to the nearest $10) paid by 20 college students for textbooks during…
A: Given that Arrange the data set in ascending order. 210, 220, 250, 280, 280, 290, 350, 350, 410,…
Q: How many variables are mentioned? How many of the variables are categorical? How many of the…
A: Introduction Variable is a characteristic that is being measured.
Q: Chapter 2: Boxplots Score: 0.71/9 0/9 answered Question 1 Y Consider the boxplot below. < Previous…
A: Given data : Min : 3 Q1 : 8 Q2 : 10 Q3 : 20 Max : 38
Q: How do I find the relative frequency given the information I received. Lower Class Limit Upper…
A: Given that Lower Class Limit Upper Class Limit Frequency 15 25 17 26 36 42 37 47 68…
Q: Assume that a sample is used to estimate a population mean μ. Find the margin of error M.E. that…
A: Given that Sample size=n=21, Sample standard deviations=S=6.8, Confidence level of 95%
Q: The height of a male college freshman has a normal distribution with a mean 81 inches an a standard…
A: Given mean = 81 inches and SD = 4 inches Let X denote the height of a male college freshman which…
Q: standard form is Z= (X-E(X)) / sigma where sigma^2 = Var(X). Compute Var(Z).
A: Given that Standard form Z=(X-E(X))/sigma Z=(X-µ)/σ E(X)=µ, Sigma=σ, Sigma2=σ2=Var(X)
Q: The coefficient of determination for a regression model is 0.4156. Which of the following…
A: The general interpretation of the coefficient of determination is the proportion of variation…
Q: The time it takes, in hours, for tickets to be sold out for an AC/DC concert follows a uniform…
A: From the provided information, The AC/DC concert follows uniform distribution with a = 0.5 and b =…
Q: Use the magnitudes (Richter scale) of the 120 earthquakes listed in the accompanying data table. Use…
A: Introduction The measures of variation gives an idea about the spread of the data.
Q: Exposure to microbial products, especially endotoxin, may have an impact on vulnerability to…
A: Given The data is as follows: U: 9.0, 4.0, 13.0, 32.0, 1.0, 5.0, 81.0, 20.0, 37.0, 15.0, 25.0 F:…
Q: 5. Consider the following five observations on y, (5, 2, 3, 2, -2) and x = (3, 2, 1,-1, 0). (a) Find…
A: Thank you for the question. As per the honor code, we are allowed to answer three sub-parts at a…
Q: Household 1 2 3 4 5 6 7 8 9 10 No. of Persons in Household 3 5426WNSNa 3 No. of Physician Visits Per…
A: Given information: The data for the number of physician visits per person during the previous year…
Q: . Noah has 1200 cows on his farm. He selections 100 cows. 25% of the cows have spots. d. Find…
A: If X is the binomial random variable with parameters n and p then the mean of X is np and variance…
Q: Goldilocks Effect: Read to Your Kids! The American Academy of Pediatrics recommends that parents…
A: Given that, In the study, 27 four- year-olds were presented with stories in three different…
Q: N₂(μ, E) with μ = (2, 2)' and Σ = 01 vectors A = (1, 1), B = (1,−1). Show that AX and BX are…
A:
Q: A large sporting outfitter carries a broad selection of golf gear. The products are marketed…
A: Given data: 19.99 19.99 47.99 44.99 27.99 21.99 27.99 39.99 28.99 21.99
Q: Q1: Suppose that at the 95% confidence level, the confidence interval estimate for population mean…
A: Given confidence interval is,43.8<μ<46.2
Q: HH Figure 2.1 15 For the distribution in the accompanying graph, what is the value of fX? 21 1 2 3 4…
A: From histogram X f fX 1 1 1 2 2 4 3 4 12 4 2 8 5 1 5
Q: A researcher is interested in the sleeping habits of community college students. The community…
A: Given that A researcher is interested in the sleeping habits of community college students. The…
Q: How strong is this relationship? Obtain the correlation. (Provide your answer to four decimal…
A: Given that: Country CO2, x Concern, y Argentina 4.67 10.7 Australia 16.52 8.75 Brazil 2.23…
Q: A sample mean, sample size, and population standard deviation are provided below. Use the one-mean…
A: The hypotheses for the test is given below. Null hypothesis: H0: µ =27 Alternative hypothesis: H1: µ…
Q: before (M.) After (₂) differences mean UD 8 6 - 2 11.6 11.1 -0.50 `n-²n = 14 14 O 13 12 -1 15 14 10…
A: The information provided in the question are as follows : Sample size (n) = 10 Also, it is given…
Q: hree decimal places.) (a) P(all of the next three vehicles inspected pass) (b) P(at least one of the…
A:
Q: 2. The probability that a patient recovers from a skin disease is 0.45. If 20 people are known to…
A: Given that Number of trials n=20 Success of probability p =0.45 X~Bin(n,p)
Q: Exponential Distribution: Website purchase times are tracked by a company's data analytics…
A: Given average time between purchases on a bookstore's website is 44 seconds. That is, μ=44.
Q: An auditor has obtained the following data by selecting a random sample from an inventory…
A: GivenThe data by selecting a random sample from an inventory population as shown below
Q: Solve the following. Show your complete solution The incoming freshman students of a particular…
A: Given that We have to 90% confidence interval for the mean difference of the exam scores :
Q: Geography North American Product Classification System (NAPCS) Spruce, pine and fir, production5 I…
A:
Q: (this is the pdf that was validated in #4 from above). Find the probability that the number lies in…
A: Let X have the pdf is, f(x)=3x2, 0≤x≤1 To find P0≤X≤13.
Q: phones are summarized on the following boxplot: 0 25 50 75 Which of the following is true about this…
A: It is given that the boxplot represents the number of contacts programmed into cell phones.
Q: Difference between shape parameter and location parameters and define the purpose of these?
A:
Q: (a) Calculate the percentage given criterion. (b) If the filling equipment the standard deviation r…
A: Let X be the random variable that is the wt. of the can. Given that, X ~ N(μ=8.05, σ=0.05) A can…
Q: The sample data below represent a variable,X: 3.5 7.6 1.9 2.3 1.8 4.7 3.4 a. Compute the…
A: Given data: Variable X 3.5 7.6 1.9 2.3 1.8 4.7 3.4
Q: Based on the following table, what proportion of students get exactly 9 hours of sleep per school…
A: The question is about frequency dist. Given : To find : Prop. of students get exactly 9 hrs. of…
Q: Using descriptive statistics, calculate a.Standard Deviation and b. Variance. Show your solution…
A: The given data is as follows. Trial Volume 1 9.988 2 9.973 3 9.986 4 9.98 5 9.975 6…
Q: Are these independent or matched pairs samples? Report the critical value. Round to three decimals.
A: It is given that the two independent samples with known population standard deviation.
Step by step
Solved in 2 steps
- A medical center, with 75,000 charts on file, has established a chart should be located within a 15-minute time frame. At the end of one month, it was determined that out of a total of 675 chart requests, 650 were located within the quality standard of 15 minutes. What is the compliance rate? (compute to 2 decimals) ______________%The population of Metroville was 3,187,463 on June 30, 2013. During the period January 1 through December 31,2013, a total of 4,367 city residents were infected with HIV. During the same year, 768 new cases of HIV were reported. Calculate the prevalence per 100,000 population and incidence per 100,000 population.s nip
- Mr.Rousellteachesdanceto120students.Onethirdofhisstudentsareinkindergarten.The restofhisstudentsareinsecondgrade.HowmanyofMr.Rousell’sstudentsareinsecond grade?Year Consumer price index 2001 0.9576707944 2001 1.043445267 2001 0.1314307172 2001 -0.2812675892 2002 0.3572771719 2002 1.086752857 2002 0.4263206673 2002 0.3137689184 2003 1.011959522 2003 0.364298725 2003 0.4900181488 2003 0.01806032147 2004 0.9028530155 2004 1.431639227 2004 0.352858151 2004 0.5977496484 2005 0.6291506466 2005 1.337269885 2005 1.216795201 2005 0.5079580088 2006 0.539083558 2006 1.692359249 2006 0.5602240896 2006 -0.8520399803 2007 1.019170385 2007 1.917329089 2007 0.2759287112 2007 1.711214555 2008 1.136773642 2008 2.195344656 2008 1.163055346 2008 -2.828529429 2009 -0.497633075 2009 1.060302337 2009 0.6790719816 2009 0.2011885888 2010 0.4014150536 2010 0.4750721517 2010 0.09325049836 2010 0.2949163207 2011 1.264822375 2011 1.743310892 2011 0.4085179843 2011 -0.1520557705 2012 0.7956386559 2012 0.8275317381 2012 0.219328148 2012 0.03604046954 2013 0.5903298758 2013…stat 10.
- The file Stock Prices contains NYSE 2019 closing prices of three stocks: Honda Motors, Ford Motor Company, and General Motors. Which stocks exhibits most and least risky behavior? Explain.#9;review ch7The following data is given for Soweto Hospital with regards to the number of patients admitted in the first half of the year ended 30 June 2023 and the total costs incurred by the hospital to treat these patients in this period:MonthNumber of patients admittedTotal costs incurred by the hospital (Rands)January20050 000February20050 000March25055 000April25055 000May30060 000June15045 000Required:Calculate the variable cost per unit and total fixed costs by using the Least Squares (Simple Regression Analysis) method.
- 17) scatterplot1. Calculate the change in on-time percentage from the previous to the current year for each carrier. Use Excel's conditional formatting to highlight the carriers whose on-time percentage decreased from the previous year to current year 2. Use Excel's conditional formatting tool to create data bars for the change in-on time percentage from the previous year to the current year for each carrier calculated in #1To encourage participation of students in various exchange programs, the Office of International Relations (OIR) is packaging a proposal for the ASEAN International Mobility for Students Fund to support student exchange programs. To gather information on financial cost and students' motivation to participate in these exchange programs, a survey of past exchange students sent out from 1995-2015 was conducted. Thirty students who have maintained close contact with OIR were interviewed. To estimate the proportion of students who are willing to participate in these exchange programs, another survey was conducted among currently enrolled students. Respondents were randomly selected from each of the nine colleges. Which of the following is(are) TRUE? I. The OR used non-probability sampling in the first survey to identify respondents among exchange students from 1995-2015II. The OIR used probability sampling in the second survey to identify currently enrolled students who are willing to…