The Fish and Game Department stocked a lake with fish in the following proportions: 30% catfish, 15% bass, 40% bluegill, and 15% pike. Five years later it sampled the lake to see if the distribution of fish had changed. It found that the 500 fish in the sample were distributed as follows. Catfish Bass Bluegill Pike 124 75 228 73 USE SALT In the 5-year interval, did the distribution of fish change at the 0.05 level? (a) What is the level of significance? State the null and alternate hypotheses. O Ho: The distributions are the same. H₁: The distributions are different. Ho: The distributions are different. H₁: The distributions are different. O Ho: The distributions are different. M₁: The distributions are the same. O Ho: The distributions are the same. H₁: The distributions are the same (b) Find the value of the chi-square statistic for the sample. (Round your answer to three decimal places.) Are all the expected frequencies greater than 5? O Yes O No What sampling distribution will you use? O uniform O chi-square O binomial O normal O Student's t What are the degrees of freedom? (c) Estimate the P-value of the sample test statistic. OP-value > 0.100 O 0.050 < P-value < 0.100 O 0.025 < P-value < 0.050 O 0.010 < P-value < 0.025 O 0.005 < P-value < 0.010 OP-value < 0.005 (d) Based on your answers in parts (a) to (c), will you reject or fail to reject the null hypothesis that the population fits the specified distribution of categories? O Since the P-value > a, we fail to reject the null hypothesis. Since the P-value > a, we reject the null hypothesis. O Since the P-value s a, we reject the null hypothesis. O Since the P-value s a, we fail to reject the null hypothesis. (e) Interpret your conclusion in the context of the application. O At the 5% level of significance, the evidence is insufficient to conclude that current fish distribution is different than that of five years ago. O At the 5% level of significance, the evidence is sufficient to conclude that current fish distribution is different than that of five years ago.
The Fish and Game Department stocked a lake with fish in the following proportions: 30% catfish, 15% bass, 40% bluegill, and 15% pike. Five years later it sampled the lake to see if the distribution of fish had changed. It found that the 500 fish in the sample were distributed as follows. Catfish Bass Bluegill Pike 124 75 228 73 USE SALT In the 5-year interval, did the distribution of fish change at the 0.05 level? (a) What is the level of significance? State the null and alternate hypotheses. O Ho: The distributions are the same. H₁: The distributions are different. Ho: The distributions are different. H₁: The distributions are different. O Ho: The distributions are different. M₁: The distributions are the same. O Ho: The distributions are the same. H₁: The distributions are the same (b) Find the value of the chi-square statistic for the sample. (Round your answer to three decimal places.) Are all the expected frequencies greater than 5? O Yes O No What sampling distribution will you use? O uniform O chi-square O binomial O normal O Student's t What are the degrees of freedom? (c) Estimate the P-value of the sample test statistic. OP-value > 0.100 O 0.050 < P-value < 0.100 O 0.025 < P-value < 0.050 O 0.010 < P-value < 0.025 O 0.005 < P-value < 0.010 OP-value < 0.005 (d) Based on your answers in parts (a) to (c), will you reject or fail to reject the null hypothesis that the population fits the specified distribution of categories? O Since the P-value > a, we fail to reject the null hypothesis. Since the P-value > a, we reject the null hypothesis. O Since the P-value s a, we reject the null hypothesis. O Since the P-value s a, we fail to reject the null hypothesis. (e) Interpret your conclusion in the context of the application. O At the 5% level of significance, the evidence is insufficient to conclude that current fish distribution is different than that of five years ago. O At the 5% level of significance, the evidence is sufficient to conclude that current fish distribution is different than that of five years ago.

Functions and Change: A Modeling Approach to College Algebra (MindTap Course List)
6th Edition
ISBN:9781337111348
Author:Bruce Crauder, Benny Evans, Alan Noell
Publisher:Bruce Crauder, Benny Evans, Alan Noell
Chapter5: A Survey Of Other Common Functions
Section5.3: Modeling Data With Power Functions
Problem 6E: Urban Travel Times Population of cities and driving times are related, as shown in the accompanying...

Related questions
Question
Q10. Please help
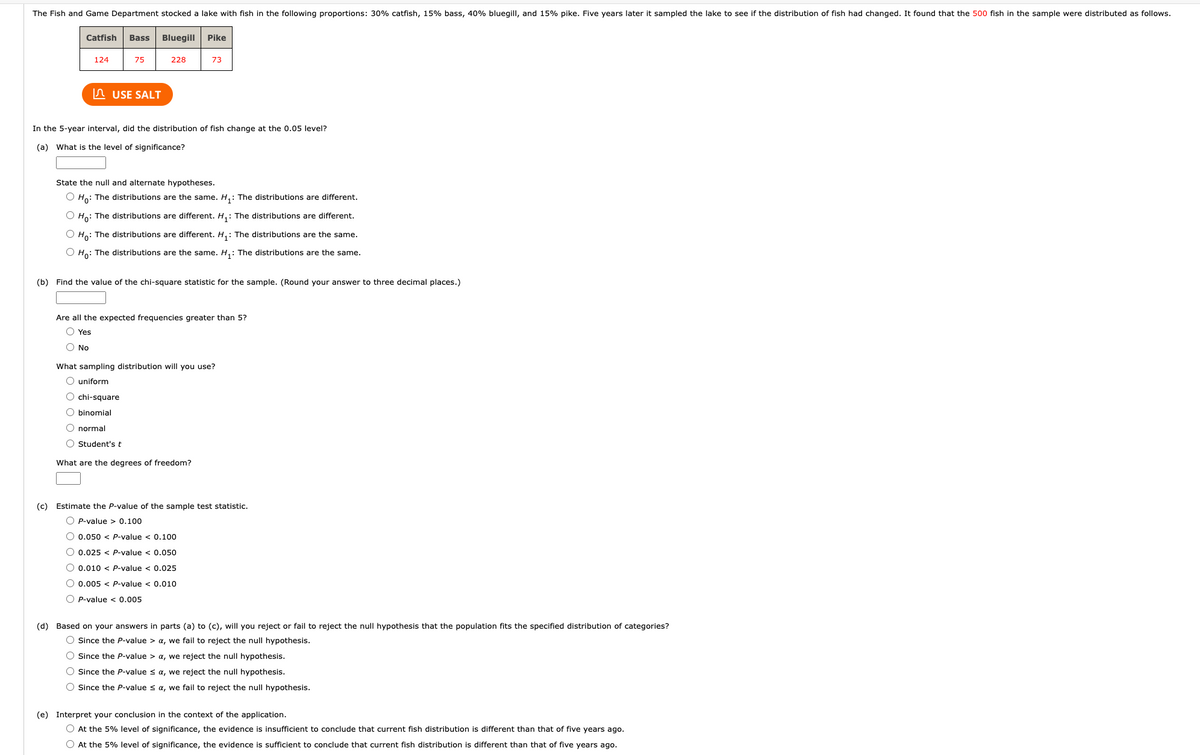
Transcribed Image Text:The Fish and Game Department stocked a lake with fish in the following proportions: 30% catfish, 15% bass, 40% bluegill, and 15% pike. Five years later it sampled the lake to see if the distribution of fish had changed. It found that the 500 fish in the sample were distributed as follows.
Catfish Bass Bluegill Pike
124
75
228
73
USE SALT
In the 5-year interval, did the distribution of fish change at the 0.05 level?
(a) What is the level of significance?
State the null and alternate hypotheses.
O Ho: The distributions are the same. H₁: The distributions are different.
O Ho: The distributions are different. H₁: The distributions are different.
O Ho: The distributions are different. H₁: The distributions are the same.
O Ho: The distributions are the same. H₁: The distributions are the same.
(b) Find the value of the chi-square statistic for the sample. (Round your answer to three decimal places.)
Are all the expected frequencies greater than 5?
Yes
O No
What sampling distribution will you use?
O uniform
O chi-square
O binomial
O normal
O Student's t
What are the degrees of freedom?
(c) Estimate the P-value of the sample test statistic.
OP-value > 0.100
O 0.050 < P-value < 0.100
O 0.025 < P-value < 0.050
0.010 < P-value < 0.025
O 0.005 < P-value < 0.010
OP-value < 0.005
(d) Based on your answers in parts (a) to (c), will you reject or fail to reject the null hypothesis that the population fits the specified distribution of categories?
O Since the P-value > a, we fail to reject the null hypothesis.
O Since the P-value > a, we reject the null hypothesis.
O Since the P-value ≤ a, we reject the null hypothesis.
O Since the P-value ≤ a, we fail to reject the null hypothesis.
(e) Interpret your conclusion in the context of the application.
O At the 5% level of significance, the evidence is insufficient to conclude that current fish distribution is different than that of five years ago.
O At the 5% level of significance, the evidence is sufficient to conclude that current fish distribution is different than that of five years ago.
Expert Solution
This question has been solved!
Explore an expertly crafted, step-by-step solution for a thorough understanding of key concepts.

This is a popular solution!

Trending now
This is a popular solution!

Step by step
Solved in 2 steps with 1 images

Recommended textbooks for you
Functions and Change: A Modeling Approach to Coll…
Algebra
ISBN:
9781337111348
Author:
Bruce Crauder, Benny Evans, Alan Noell
Publisher:
Cengage Learning

Holt Mcdougal Larson Pre-algebra: Student Edition…
Algebra
ISBN:
9780547587776
Author:
HOLT MCDOUGAL
Publisher:
HOLT MCDOUGAL

Glencoe Algebra 1, Student Edition, 9780079039897…
Algebra
ISBN:
9780079039897
Author:
Carter
Publisher:
McGraw Hill
Functions and Change: A Modeling Approach to Coll…
Algebra
ISBN:
9781337111348
Author:
Bruce Crauder, Benny Evans, Alan Noell
Publisher:
Cengage Learning
Holt Mcdougal Larson Pre-algebra: Student Edition…
Algebra
ISBN:
9780547587776
Author:
HOLT MCDOUGAL
Publisher:
HOLT MCDOUGAL
Glencoe Algebra 1, Student Edition, 9780079039897…
Algebra
ISBN:
9780079039897
Author:
Carter
Publisher:
McGraw Hill