The following analysis was obtained using data in MEAP93, which contains school-level pass rates (as a percent) on a tenth-grade math test. (i) The variable expend is expenditures per student, in dollars, and math10 is the pass rate on the exam. The following simple regression relates math10 to lexpend = log(expend): math10 = -69.34 + 11.16 lexpend (25.53) (3.17) n = 408, R² = .0297. Interpret the coefficient on lexpend. In particular, if expend increases by 10%, what is the esti- mated percentage point change in math10? What do you make of the large negative intercept estimate? (The minimum value of lexpend is 8.11 and its average value is 8.37.) (ii) Does the small R-squared in part (i) imply that spending is correlated with other factors affecting math10? Explain. Would you expect the R-squared to be much higher if expendi- tures were randomly assigned to schoolsthat is, independent of other school and student characteristics-rather than having the school districts determine spending? (iii) When log of enrollment and the percent of students eligible for the federal free lunch program are included, the estimated equation becomes math10 = -23.14 + 7.75 lexpend – 1.26 lenroll – .324 Inchprg (24.99) (3.04) (0.58) (0.36) n = 408, R? = .1893. Comment on what happens to the coefficient on lexpend. Is the spending coefficient still statisti- cally different from zero? (iv) What do you make of the R-squared in part (iii)? What are some other factors that could be used to explain math10 (at the school level)?
The following analysis was obtained using data in MEAP93, which contains school-level pass rates (as a percent) on a tenth-grade math test. (i) The variable expend is expenditures per student, in dollars, and math10 is the pass rate on the exam. The following simple regression relates math10 to lexpend = log(expend): math10 = -69.34 + 11.16 lexpend (25.53) (3.17) n = 408, R² = .0297. Interpret the coefficient on lexpend. In particular, if expend increases by 10%, what is the esti- mated percentage point change in math10? What do you make of the large negative intercept estimate? (The minimum value of lexpend is 8.11 and its average value is 8.37.) (ii) Does the small R-squared in part (i) imply that spending is correlated with other factors affecting math10? Explain. Would you expect the R-squared to be much higher if expendi- tures were randomly assigned to schoolsthat is, independent of other school and student characteristics-rather than having the school districts determine spending? (iii) When log of enrollment and the percent of students eligible for the federal free lunch program are included, the estimated equation becomes math10 = -23.14 + 7.75 lexpend – 1.26 lenroll – .324 Inchprg (24.99) (3.04) (0.58) (0.36) n = 408, R? = .1893. Comment on what happens to the coefficient on lexpend. Is the spending coefficient still statisti- cally different from zero? (iv) What do you make of the R-squared in part (iii)? What are some other factors that could be used to explain math10 (at the school level)?

Chapter6: Exponential And Logarithmic Functions
Section6.8: Fitting Exponential Models To Data
Problem 3TI: Table 6 shows the population, in thousands, of harbor seals in the Wadden Sea over the years 1997 to...

Related questions
Question
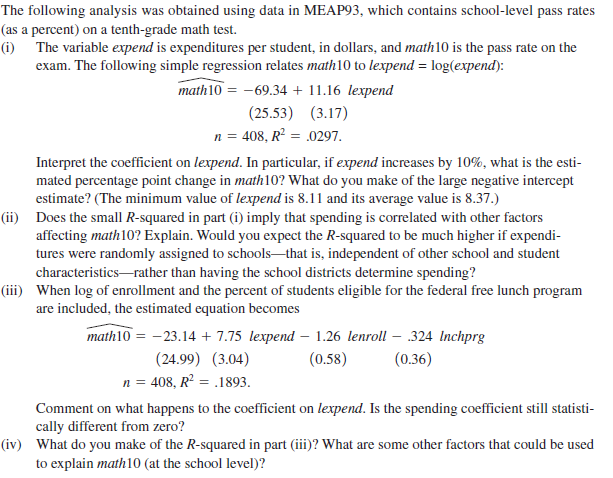
Transcribed Image Text:The following analysis was obtained using data in MEAP93, which contains school-level pass rates
(as a percent) on a tenth-grade math test.
(i) The variable expend is expenditures per student, in dollars, and math10 is the pass rate on the
exam. The following simple regression relates math10 to lexpend = log(expend):
math10 = -69.34 + 11.16 lexpend
(25.53) (3.17)
n = 408, R² = .0297.
Interpret the coefficient on lexpend. In particular, if expend increases by 10%, what is the esti-
mated percentage point change in math10? What do you make of the large negative intercept
estimate? (The minimum value of lexpend is 8.11 and its average value is 8.37.)
(ii) Does the small R-squared in part (i) imply that spending is correlated with other factors
affecting math10? Explain. Would you expect the R-squared to be much higher if expendi-
tures were randomly assigned to schoolsthat is, independent of other school and student
characteristics-rather than having the school districts determine spending?
(iii) When log of enrollment and the percent of students eligible for the federal free lunch program
are included, the estimated equation becomes
math10 = -23.14 + 7.75 lexpend – 1.26 lenroll – .324 Inchprg
(24.99) (3.04)
(0.58)
(0.36)
n = 408, R? = .1893.
Comment on what happens to the coefficient on lexpend. Is the spending coefficient still statisti-
cally different from zero?
(iv) What do you make of the R-squared in part (iii)? What are some other factors that could be used
to explain math10 (at the school level)?
Expert Solution
This question has been solved!
Explore an expertly crafted, step-by-step solution for a thorough understanding of key concepts.

This is a popular solution!

Trending now
This is a popular solution!

Step by step
Solved in 2 steps with 2 images

Recommended textbooks for you

Algebra & Trigonometry with Analytic Geometry
Algebra
ISBN:
9781133382119
Author:
Swokowski
Publisher:
Cengage
Algebra & Trigonometry with Analytic Geometry
Algebra
ISBN:
9781133382119
Author:
Swokowski
Publisher:
Cengage