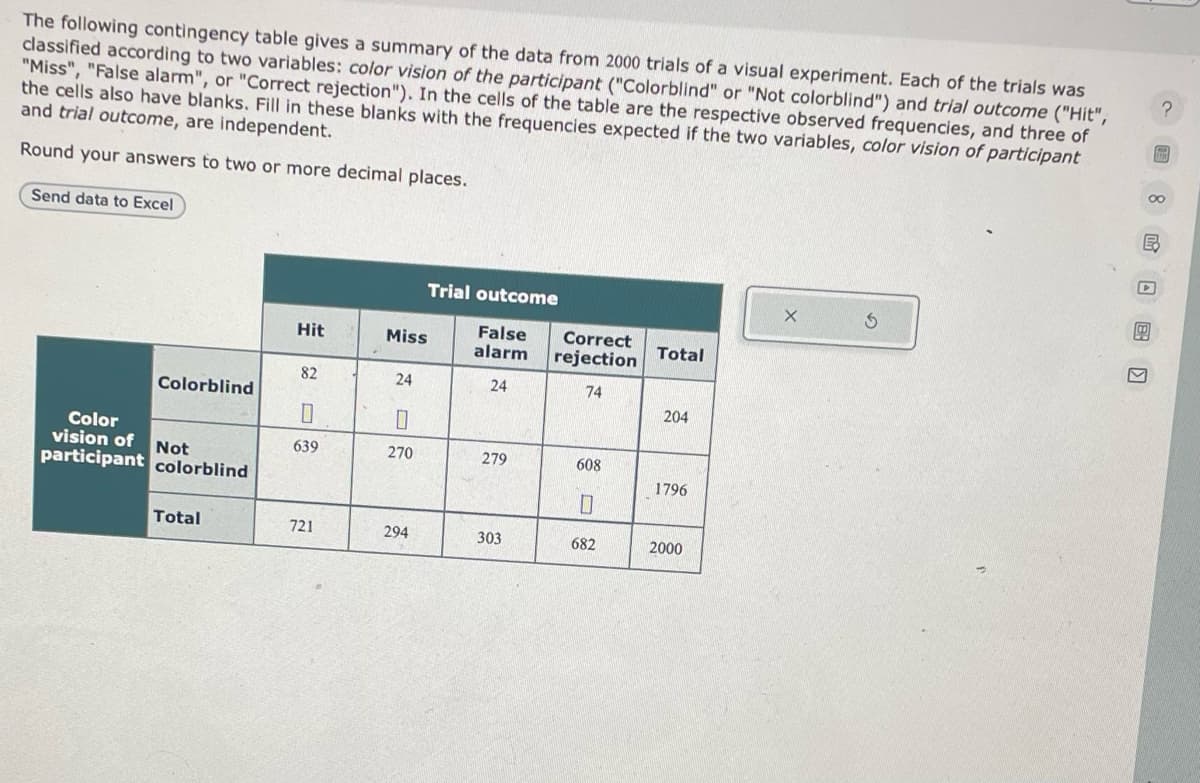
The following contingency table gives a summary of the data from 2000 trials of a visual experiment. Each of the trials was classified according to two variables: color vision of the participant ("Colorblind" or "Not colorblind") and trial outcome ("Hit", "Miss", "False alarm", or "Correct rejection"). In the cells of the table are the respective observed frequencies, and three of the cells also have blanks. Fill in these blanks with the frequencies expected if the two variables, color vision of participant and trial outcome, are independent. Round your answers to two or more decimal places. Send data to Excel Colorblind Color vision of Not participant colorblind Total Hit 82 0 639 721 Miss 24 0 270 Trial outcome 294 False Correct alarm rejection 24 74 279 303 608 0 682 Total 204 1796 2000 E
The following contingency table gives a summary of the data from 2000 trials of a visual experiment. Each of the trials was classified according to two variables: color vision of the participant ("Colorblind" or "Not colorblind") and trial outcome ("Hit", "Miss", "False alarm", or "Correct rejection"). In the cells of the table are the respective observed frequencies, and three of the cells also have blanks. Fill in these blanks with the frequencies expected if the two variables, color vision of participant and trial outcome, are independent. Round your answers to two or more decimal places. Send data to Excel Colorblind Color vision of Not participant colorblind Total Hit 82 0 639 721 Miss 24 0 270 Trial outcome 294 False Correct alarm rejection 24 74 279 303 608 0 682 Total 204 1796 2000 E

Glencoe Algebra 1, Student Edition, 9780079039897, 0079039898, 2018
18th Edition
ISBN:9780079039897
Author:Carter
Publisher:Carter
Chapter10: Statistics
Section: Chapter Questions
Problem 13PT

Related questions
Question
Transcribed Image Text:The following contingency table gives a summary of the data from 2000 trials of a visual experiment. Each of the trials was
classified according to two variables: color vision of the participant ("Colorblind" or "Not colorblind") and trial outcome ("Hit",
"Miss", "False alarm", or "Correct rejection"). In the cells of the table are the respective observed frequencies, and three of
the cells also have blanks. Fill in these blanks with the frequencies expected if the two variables, color vision of participant
and trial outcome, are independent.
Round your answers to two or more decimal places.
Send data to Excel
Colorblind
Color
vision of Not
participant colorblind
Total
Hit
82
0
639
721
Miss
24
0
270
Trial outcome
False
alarm
24
294
279
303
Correct
rejection
74
608
0
682
Total
204
1796
2000
X
?
F
8 MB)
Expert Solution
This question has been solved!
Explore an expertly crafted, step-by-step solution for a thorough understanding of key concepts.

This is a popular solution!

Trending now
This is a popular solution!

Step by step
Solved in 2 steps

Recommended textbooks for you
Glencoe Algebra 1, Student Edition, 9780079039897…
Algebra
ISBN:
9780079039897
Author:
Carter
Publisher:
McGraw Hill


Holt Mcdougal Larson Pre-algebra: Student Edition…
Algebra
ISBN:
9780547587776
Author:
HOLT MCDOUGAL
Publisher:
HOLT MCDOUGAL
Glencoe Algebra 1, Student Edition, 9780079039897…
Algebra
ISBN:
9780079039897
Author:
Carter
Publisher:
McGraw Hill
Holt Mcdougal Larson Pre-algebra: Student Edition…
Algebra
ISBN:
9780547587776
Author:
HOLT MCDOUGAL
Publisher:
HOLT MCDOUGAL

Algebra & Trigonometry with Analytic Geometry
Algebra
ISBN:
9781133382119
Author:
Swokowski
Publisher:
Cengage