(b) Briefly give an example each of studies where you can apply (i) stratified sampling and (ii) cluster sampling at Oakland University. (c) Give one weakness that you must beware when collecting data by a sampling method.
(b) Briefly give an example each of studies where you can apply (i) stratified sampling and (ii) cluster sampling at Oakland University. (c) Give one weakness that you must beware when collecting data by a sampling method.

College Algebra (MindTap Course List)
12th Edition
ISBN:9781305652231
Author:R. David Gustafson, Jeff Hughes
Publisher:R. David Gustafson, Jeff Hughes
Chapter8: Sequences, Series, And Probability
Section8.7: Probability
Problem 6E: List the sample space of each experiment. Tossing three coins

Related questions
Question
100%
Kindly solve it Asap!
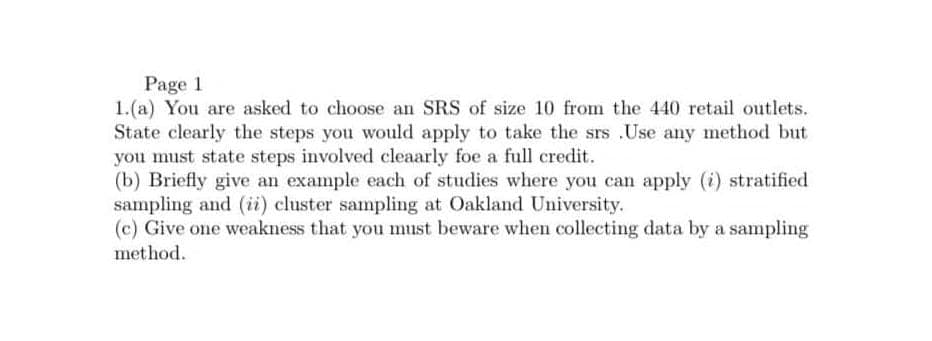
Transcribed Image Text:Page 1
1.(a) You are asked to choose an SRS of size 10 from the 440 retail outlets.
State clearly the steps you would apply to take the srs .Use any method but
you must state steps involved cleaarly foe a full credit.
(b) Briefly give an example each of studies where you can apply (i) stratified
sampling and (ii) cluster sampling at Oakland University.
(c) Give one weakness that you must beware when collecting data by a sampling
method.
Expert Solution
This question has been solved!
Explore an expertly crafted, step-by-step solution for a thorough understanding of key concepts.

Step by step
Solved in 3 steps

Recommended textbooks for you
College Algebra (MindTap Course List)
Algebra
ISBN:
9781305652231
Author:
R. David Gustafson, Jeff Hughes
Publisher:
Cengage Learning

Holt Mcdougal Larson Pre-algebra: Student Edition…
Algebra
ISBN:
9780547587776
Author:
HOLT MCDOUGAL
Publisher:
HOLT MCDOUGAL

College Algebra (MindTap Course List)
Algebra
ISBN:
9781305652231
Author:
R. David Gustafson, Jeff Hughes
Publisher:
Cengage Learning
Holt Mcdougal Larson Pre-algebra: Student Edition…
Algebra
ISBN:
9780547587776
Author:
HOLT MCDOUGAL
Publisher:
HOLT MCDOUGAL