The following data are the joint temperatures of the O-rings (°F) for each test firing or actual launch of the space shuttle rocket motor (from Presidential Commission on the Space Shuttle Challenger Accident, Vol. 1, pp. 129-131): 83 49 61 40 83 67 45 66 70 69 80 58 68 60 67 72 73 70 57 63 70 78 52 67 53 67 75 Round your answers to 2 decimal places (e.g. 98.76). (a) Using the entire data, calculate the sample mean and sample standard deviation. Sample mean = 65.83 Sample standard deviation = (b) Remove the smallest observation (31°F) and calculate the sample mean and sample standard deviation of the remaining data. Sample mean Sample standard deviation-
The following data are the joint temperatures of the O-rings (°F) for each test firing or actual launch of the space shuttle rocket motor (from Presidential Commission on the Space Shuttle Challenger Accident, Vol. 1, pp. 129-131): 83 49 61 40 83 67 45 66 70 69 80 58 68 60 67 72 73 70 57 63 70 78 52 67 53 67 75 Round your answers to 2 decimal places (e.g. 98.76). (a) Using the entire data, calculate the sample mean and sample standard deviation. Sample mean = 65.83 Sample standard deviation = (b) Remove the smallest observation (31°F) and calculate the sample mean and sample standard deviation of the remaining data. Sample mean Sample standard deviation-

Glencoe Algebra 1, Student Edition, 9780079039897, 0079039898, 2018
18th Edition
ISBN:9780079039897
Author:Carter
Publisher:Carter
Chapter10: Statistics
Section10.1: Measures Of Center
Problem 9PPS

Related questions
Question
100%
Asap
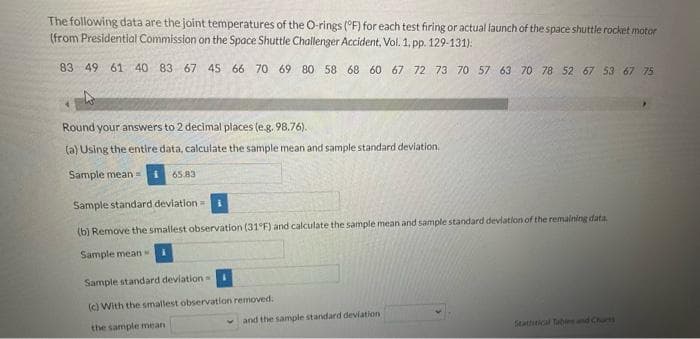
Transcribed Image Text:The following data are the joint temperatures of the O-rings (°F) for each test firing or actual launch of the space shuttle rocket motor
(from Presidential Commission on the Space Shuttle Challenger Accident, Vol. 1, pp. 129-131):
83 49 61 40 83 67 45 66 70 69 80 58 68 60 67 72 73 70 57 63 70 78 52 67 53 67 75
Round your answers to 2 decimal places (e.g. 98.76).
(a) Using the entire data, calculate the sample mean and sample standard deviation.
Sample mean =
65.83
Sample standard deviation i
(b) Remove the smallest observation (31°F) and calculate the sample mean and sample standard deviation of the remaining data.
Sample mean
Sample standard deviations
(c) With the smallest observation removed.
the sample mean
and the sample standard deviation
Stathitical Tables and Charts
Expert Solution
This question has been solved!
Explore an expertly crafted, step-by-step solution for a thorough understanding of key concepts.

This is a popular solution!

Trending now
This is a popular solution!

Step by step
Solved in 3 steps

Recommended textbooks for you
Glencoe Algebra 1, Student Edition, 9780079039897…
Algebra
ISBN:
9780079039897
Author:
Carter
Publisher:
McGraw Hill
Glencoe Algebra 1, Student Edition, 9780079039897…
Algebra
ISBN:
9780079039897
Author:
Carter
Publisher:
McGraw Hill