The following data consist of the present school enrollment of the Dr. Vesse High School. A study on the recent teaching strategies will be conducted in this school. Year Level First Second Third Fourth Population size 150 185 220 245 1. How many samples should the researcher take if she will use 1% margin of error? A. 8 B. 741 C. 751 D. 761 2. Using stratified random sampling, if 200 will be taken as sample, how many representatives from the first year should be drawn? A. 30 B. 38 C. 76 D. 100 FOR 3-8: An important application of regression analysis is in the estimation of cost. By collecting data on volume and cost and using the least squares method to develop an estimated regression equation relating volume and cost, one can estimate the cost associated with a particular manufacturing volume. Consider the following sample of monthly production volumes and total costs data for a manufacturing operation for the year 2018. Month (Year 2018) Production Volume (units) Total Costs ($) January 500 6,000 February 350 4,000 March 450 5,000 April 550 5,400 May 600 5.900 June 400 4,000 July 400 4,200 August 350 3,900 September 400 4,300 October 600 6,000 November 700 6,400 December 750 7,000 3. Which of the following is NOT necessarily true about the interpretation of the value of b in the simple linear regression equation y = a + bx for this problem? I. The monthly total costs will increase by $7.6437 for every one-unit increase in the production volume. II. Since b > 0, there is a direct relationship between production volume and total costs. III. Because b > 1, there is a very strong positive linear relationship between production volume and total costs. A. i and ii only B. ii only C. iii only D. ii and iii only 4. Which of the following statements are true about the dependent (or response) and independent (or predictor) variables for the simple linear model in this problem? I. Production volume is dependent on total costs. II. The predictor and response variables are the production volume and total costs, respectively. III. The total costs can be projected using the simple linear regression equation if the production volume is known. A. i and ii only B. i and iii only C. ii and iii only D. i, ii, and iii 5. Calculate the (Pearson) correlation coefficient between production volume and total costs in this problem. A. 0.8391 B. 0.9571 C. 0.9160 D. 0.9783 6. Which of the following is the most suitable interpretation of the (Pearson) correlation coefficient between production volume and total costs in this problem? A. There is a perfect positive correlation between production volume and total costs. B. There is a very strong positive correlation between production volume and total costs. C. There is a strong positive correlation between production volume and total costs. D. There is a positive correlation between production volume and total costs. 7. The equation of the regression line is given by A. ? = −116.01 + 0.12? B. ? = 1321.32 − 7.64? C. ? = 116.01 + 0.12? D. ? = 7.64? + 1321.32 8. How much is the estimated total costs if the corresponding production volume for a particular month is 300 units? A. $274.80 B. $287.13 C. $2,293.11 D. $3,614.43 FOR 9-12: Refer to the following LP model. Minimize: ? = 4? + 8? subject to: ? + 1.5? ≥ 45 2? + 0.5? ≥ 40 ? + ? ≤ 40 ?,? ≥ 0 9. Which of the following is the correct illustration of the feasible region for the given LP model? 10. How many corner points are there in this LP problem? A. 1 B. 2 C. 3 D. 4 11. Which of the following points is a corner point in the feasible region which provides the optimal solution for this LP problem? A. (0,30) B. (30,10) C. (15,20) D. (40,0) 12. Which of the following is the optimal value of the objective function for the LP model in this problem? A. 240 B. 220 C. 200 D. 160


The following data consist of the present school enrollment of the Dr. Vesse High School. A study on the recent teaching strategies will be conducted in this school.
| Year Level | First | Second | Third | Fourth |
| Population size | 150 | 185 | 220 | 245 |
1. How many samples should the researcher take if she will use 1% margin of error?
A. 8
B. 741
C. 751
D. 761
2. Using stratified random sampling, if 200 will be taken as sample, how many representatives from the first year should be drawn?
A. 30
B. 38
C. 76
D. 100
FOR 3-8: An important application of
| Month (Year 2018) | Production Volume (units) | Total Costs ($) |
| January | 500 | 6,000 |
| February | 350 | 4,000 |
| March | 450 |
5,000 |
| April | 550 | 5,400 |
| May | 600 | 5.900 |
| June | 400 | 4,000 |
| July | 400 | 4,200 |
| August | 350 | 3,900 |
| September | 400 | 4,300 |
| October | 600 | 6,000 |
| November | 700 | 6,400 |
| December | 750 | 7,000 |
3. Which of the following is NOT necessarily true about the interpretation of the value of b in the simple linear regression equation y = a + bx for this problem?
I. The monthly total costs will increase by $7.6437 for every one-unit increase in the production volume.
II. Since b > 0, there is a direct relationship between production volume and total costs.
III. Because b > 1, there is a very strong positive linear relationship between production volume and total costs.
A. i and ii only
B. ii only
C. iii only
D. ii and iii only
4. Which of the following statements are true about the dependent (or response) and independent (or predictor) variables for the simple linear model in this problem?
I. Production volume is dependent on total costs.
II. The predictor and response variables are the production volume and total costs, respectively.
III. The total costs can be projected using the simple linear regression equation if the production volume is known.
A. i and ii only
B. i and iii only
C. ii and iii only
D. i, ii, and iii
5. Calculate the (Pearson)
A. 0.8391
B. 0.9571
C. 0.9160
D. 0.9783
6. Which of the following is the most suitable interpretation of the (Pearson) correlation coefficient between production volume and total costs in this problem?
A. There is a perfect
B. There is a very strong positive correlation between production volume and total costs.
C. There is a strong positive correlation between production volume and total costs.
D. There is a positive correlation between production volume and total costs.
7. The equation of the regression line is given by
A. ? = −116.01 + 0.12?
B. ? = 1321.32 − 7.64?
C. ? = 116.01 + 0.12?
D. ? = 7.64? + 1321.32
8. How much is the estimated total costs if the corresponding production volume for a particular month is 300 units?
A. $274.80
B. $287.13
C. $2,293.11
D. $3,614.43
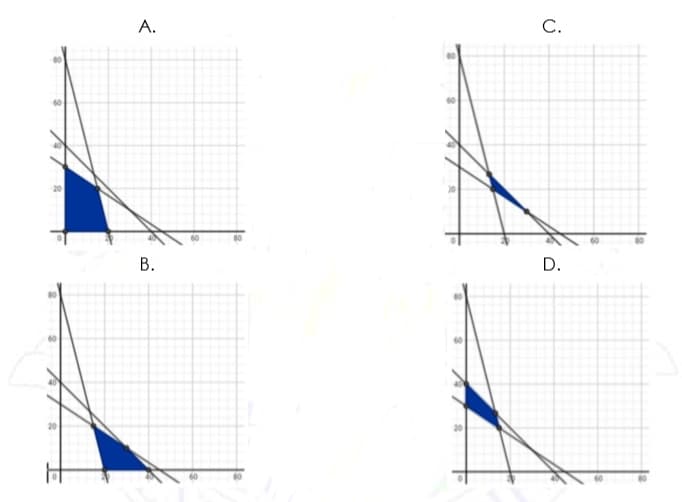
FOR 9-12: Refer to the following LP model.
Minimize: ? = 4? + 8?
subject to: ? + 1.5? ≥ 45
2? + 0.5? ≥ 40
? + ? ≤ 40
?,? ≥ 0
9. Which of the following is the correct illustration of the feasible region for the given LP model?
10. How many corner points are there in this LP problem?
A. 1
B. 2
C. 3
D. 4
11. Which of the following points is a corner point in the feasible region which provides the optimal solution for this LP problem?
A. (0,30)
B. (30,10)
C. (15,20)
D. (40,0)
12. Which of the following is the optimal value of the objective
A. 240
B. 220
C. 200
D. 160


Trending now
This is a popular solution!

Step by step
Solved in 4 steps with 1 images


