The following data consist of the scores that 10students obtained in an examination, their I.Q.’s, andthe numbers of hours they spent studying for theexamination: Number ofI.Q. hours studied Scorex1 x2 y112 5 79126 13 97100 3 51114 7 65112 11 82121 9 93110 8 81103 4 38111 6 60124 2 86 (a) Assuming that the regression is linear, estimate β0, β1,and β2.(b) Predict the score of a student with an I.Q. of 108 whostudied 6 hours for the examination.


Correlation
Correlation defines a relationship between two independent variables. It tells the degree to which variables move in relation to each other. When two sets of data are related to each other, there is a correlation between them.
Linear Correlation
A correlation is used to determine the relationships between numerical and categorical variables. In other words, it is an indicator of how things are connected to one another. The correlation analysis is the study of how variables are related.
Regression Analysis
Regression analysis is a statistical method in which it estimates the relationship between a dependent variable and one or more independent variable. In simple terms dependent variable is called as outcome variable and independent variable is called as predictors. Regression analysis is one of the methods to find the trends in data. The independent variable used in Regression analysis is named Predictor variable. It offers data of an associated dependent variable regarding a particular outcome.
The following data consist of the scores that 10
students obtained in an examination, their I.Q.’s, and
the numbers of hours they spent studying for the
examination:
Number of
I.Q. hours studied Score
x1 x2 y
112 5 79
126 13 97
100 3 51
114 7 65
112 11 82
121 9 93
110 8 81
103 4 38
111 6 60
124 2 86
(a) Assuming that the regression is linear, estimate β0, β1,
and β2.
(b) Predict the score of a student with an I.Q. of 108 who
studied 6 hours for the examination.
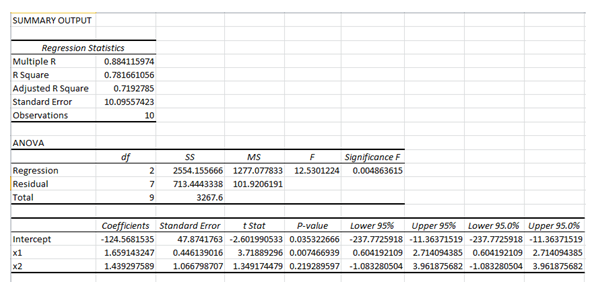
a)
Regression:
The regression analysis is conducted here by using EXCEL. The software procedure is given below:
- Enter the data.
- Select Data > Data Analysis >Regression> OK.
- Enter Input Y Range as Y.
- Enter Input X Range as X1,x2.
- Click OK.
The output using EXCEL is as follows:

Step by step
Solved in 2 steps with 2 images


