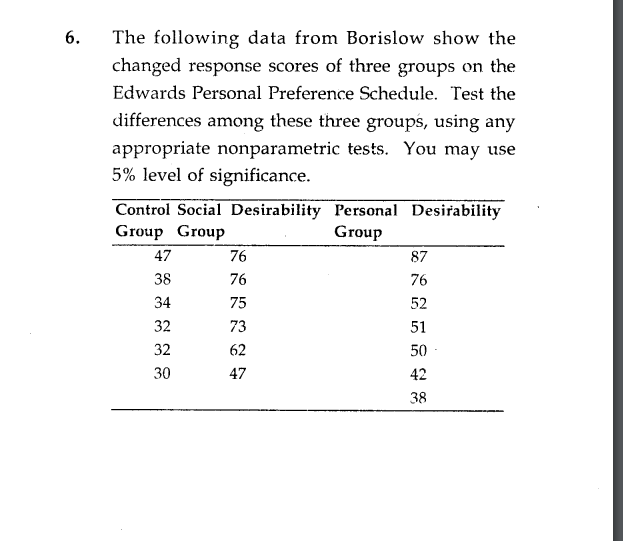
The following data from Borislow show the changed response scores of three groups on the Edwards Personal Preference Schedule. Test the differences among these three groups, using any appropriate nonparametric tests. You may use 5% level of significance.


Q: Question 10 The average and standard deviation of the weights of 350 Indian students are 55 kg and 3…
A:
Q: 3. Mr. Blue and wife were about to celebrate their 15th wedding anniversary. To reserve a hall, they…
A: Given that: 5 equations are presented as: Y=KXY=X2Y=-XY=MX+BY=2X
Q: How many apps? According to a website, the mean number of apps on a smartphone in the United States…
A: It is given that the mean is 86 and the standard deviation is 26.
Q: The accompanying table shows the numbers of male and female students in a certain region who…
A: a) The total number of students is n = 1779539.
Q: An epidemiologist found five cases of “big toe cancer” in the Yukon Territory. Because there were…
A: Answer:
Q: The probability of drawing a red face card from a deck of cards. Leave your answer as a percent to…
A: GivenTotal no.of cards in deck=52No.of red face cards = 6 (i.e., red king,red…
Q: What is the significance of the mean of a probability distribution? Choose the correct answer below.…
A:
Q: What is the mean of the average waiting time of 65 passengers?
A: HERE given , Bus waiting time is uniformly distributed with the shortest and the longest waiting…
Q: The diameter of holes for a cable harness is known to have a normal distribution with o = 0.02…
A: The following information has been provided: The population standard deviation is σ=0.02. The sample…
Q: If a school district takes a random sample of 53 Math SAT scores and finds that the average is 488,…
A: Given Information: Sample size n=53 Sample mean x¯=488 Population standard deviation σ=100
Q: Consider a bivariate normal population with μ1 = 1, μ2 = 2, σ11 = 1, σ22 = 2, and σ12 = 0.4. (a)…
A: Given μ1 = 1, μ2 = 2, σ11 = 1, σ22 = 2, and σ12 = 0.4
Q: When X is a binomial random variable, then the probability X ≤ r successes can be found using the…
A: Given X is a binomial random variable n=No. of trials=125 p=Probability of success=0.016
Q: 1. Use the Standard Normal Distribution table to find P(-1.65 < Z ≤ 1.93) 2. Use the Standard…
A: Answer: 1.
Q: A local brewery sells their beer in 330 ml bottles. On average the beer is filled with 328.4 ml with…
A: Given: Part : 4.a Mean = 328.4 Standard deviation = 0.8 Sample size = 6 Part:4.b Mean = 327.9…
Q: s, proof that (A UB)' =_
A: we have given A={0,1,2,6} B={4,6,5} C={1,3,5}
Q: If my p-value = .322 and my significant level is .05 , then
A:
Q: Suppose that the random variables X₁,..., X, form a random sample from a standard normal…
A: Note: Hi there! Thank you for posting the question. As you have posted multiple questions, as per…
Q: What is the purpose of a scatterplot? Why will you rarely find a perfect correlation between any two…
A: Scatter plots are the graphs that present the relationship between two variables in a data-set. It…
Q: A political campaign is interested in whether a geographic difference existed in support for raising…
A:
Q: The mean voltage and standard deviation of 8 batteries from each manufacturer were measured. The…
A: Given, Manufacturer Sample mean voltage (millivolts) Population standard deviation(millivolts)…
Q: Q2: Shear strengths of 60 spot welds in a titanium alloy follow: 5408 5431 5475 5442 5376 5388 5459…
A: The objective is to construct a frequency distribution table for the weld strength containing only…
Q: A random sample of 60 suspension helmets used by motorcycle riders and automobile race-car drivers…
A: The sample is the any fraction of the population. Population is the whole set of observation used…
Q: A data set includes data from student evaluations of courses. The summary statistics are n=85,…
A: Suppose μ defines the population mean of student course evaluation.
Q: Find the proportion given n=39 and .X= 33 Group of answer choices A.0.15. B. 0.85 C. 0.46 D.…
A: Given data n=39 x=33
Q: Suppose that the speed at which cars go on the freeway is normally distributed with mean 67 mph and…
A: Solution
Q: Spectators are interested to know if the ages of gymnasts competing in the Canada Games are…
A: Give that: Female Gymnasts Age Male Gymnasts Age 15 17 16 12 17 17 14 15 16 16 15 16…
Q: For the Orlando real estate investment problem, assume the probabilities for the stable supply and…
A: GIVEN:- Profit or loss that could occur from each investment is given in the form of a table, which…
Q: Both sets of values have an average of 13. Set A standard deviation smaller, larger, or about the…
A:
Q: A linear model was fit to predict weekly Sales of frozen pizza (in pounds) from the average Price…
A: The linear model, i.e., the regression line of y (i.e., the weekly sales) on x (i.e., the price of…
Q: (You shall use calculator in completing this problem. Express your solution up to 3rd decimal…
A: In case of multiple subparts, answer to first three subparts will be provided. Kindly post other…
Q: A clinical researcher performs a clinical trial on 6 patients to determine whether a drug treatment…
A:
Q: Based on this information, what is the probability that an individual actually has Lyme disease…
A: Let us define some events A : an individual has Lyme disease. B : an individual does not have…
Q: The following data represent a set of 10 experimental runs in which two independent variables X1 and…
A: The provided information is Y X1 X2 61.5 2400 54.5 61.2 2450 56.4 32 2500 43.2 52.5 2700…
Q: Question 3a. [. At a certain gas station, 65% of the customers use regular gas, and all the other…
A: Given: 65% of the customers uses regular gas 100%-65% = 35% of the customers uses premium gas.…
Q: Suppose x has a distribution with μ = 13 and σ = 9. USE SALT (a) If a random sample of size n = 31…
A: Given: μ=13σ=12 Formula: σx¯=σn
Q: 29% adults favor the use of unmanned drones by police agencies. Twelve U.S. adults are randomly…
A:
Q: Using data for the years 2005 to 2019 for US, an economist obtained the following demand function…
A:
Q: Suppose that real income per capita in New Jersey increases by 1% in the next year. Use the results…
A: Introduction: We need to predict the amount of change in the dependent variable, the number of…
Q: The amount of time spouses shop for anniversary cards can be modeled by an exponential distribution…
A:
Q: wo hundred graduating students are selected and it is found that 114 will irst class honors degrees.…
A: Given data,No of graduate students n= is 200No of awarded is x=114Calculate 96% CI?
Q: Toyota 18 Nissan 12 BMW 11 of this distribution is
A: Data which are either numerical or otherwise collected with definite purpose are called data There…
Q: Overproduction of uric acid in the body can be an indication of cell breakdown. This may be an…
A: Since you have posted a question with multiple sub-parts, we will solve first three subparts for…
Q: For a random sample of 36 data pairs, the sample mean of the differences was 0.75. The sample…
A: The question is about paired t test Given : Total no. of data pairs ( n ) = 36 Sample mean of…
Q: question 1: Explain the Discrete and Continuous Markov Chains. Discuss the models for the two chains…
A: Discrete-time Markov chain : A Discrete-Time Markov Chain can be used to describe the behavior of a…
Q: ount of time spouses shop for anniversary cards can be modeled by an exponential distribution with…
A: It is given that the The amount of time spouses shop for anniversary cards can be modelled by an…
Q: Suppose in a random sample of 241 individuals, 28 are considered success. Compute the margin of…
A:
Q: Write a comprehensive note on types of sampling procedure applied for drawing samples.
A: Comment: “Since you have asked multiple questions, we will solve the first question for you. If you…
Q: A new type of speed trap camera is being evaluated to be used for detecting over speeding vehicles.…
A: The hypotheses are given below: Null hypothesis: H0: p=0.80. Alternative hypothesis: Ha:p>0.80.…
Q: Let X denote the waiting time at a bust stop. The waiting time at a bus stop is continuous uniformly…
A: From the provided information, The waiting time at a bus stop is continuous uniformly distributed…
Q: Specific Directions for Capstone Assessment • Refer to this problem. The set of questions will be…
A: Given data is: .

Step by step
Solved in 3 steps

- A sample of employees at a large chemical plant was asked to indicate a preference for one of three pension plans. The results are given in the following table. Does it seem that there is a relationship between the pension plan selected and the job classification of the employees? Use the .01 significance level. Pension Plan Job Class Plan A Plan B Plan C Supervisor 10 13 29 Clerical 19 80 19 Labor 81 57 224.A researcher used a sample of n = 50 individuals to determine whether they are any preferences between two new designs for a smart phone (iphone vs samsung) depending on whether they have a PC or Mac computer. If the data produce a chi-square statistic of χ2 = 7.00 what decision should the researcher make? a.There is a significant preference at both α = .05 and α = .01. b.There is no significant preference at α = .05 but there is at α = .01. c.There is a significant preference at α = .05 but not at α = .01. d.There is no significant preference at either α = .05 or α = .01.4. A market analysis wishes to see whether consumers have any preference between five different flavors of chewing gum. A sample of 100 people provided the data below. Does enough evidence exist to reject the claim that no preference exists in the selection of chewing gum flavors? Frequency Observed Expected Mint 32 20 Bubble Gum 28 20 Strawberry 16 20 Grape 14 20 Orange 10 20
- 4. The following table reported the results of a survey on how members would prefer to receive ballots in annual elections. At the 5% significance level, do the data provide sufficient evidence to conclude that gender and preference are associated?The marketing department of your game making company wants to determine if socioeconomic status isrelated to game playing preferences. 100 children, in total, were identified from families of low, middle,and high socioeconomic status and asked to select on of Monopoly, Battleship, or Connect Four. Theresults are shown in the table below. Is there evidence that socioeconomic status is related to gameplaying preference? Use ? = 0.05. Clearly state your hypotheses and provide the relevant p-valueSaeko owns a yarn shop and want to expands her color selection. Before she expands her colors, she wants to find out if her customers prefer one brand over another brand. Specifically, she is interested in three different types of bison yarn. As an experiment, she randomly selected 21 different days and recorded the sales of each brand. At the .10 significance level, can she conclude that there is a difference in preference between the brands? Misa's Bison Yak-et-ty-Yaks Buffalo Yarns 799 776 799 784 640 931 873 822 794 702 812 920 795 673 731 875 893 837 Total 4,828.00 4,616.00 5,012.00 6) What is the null hypothesis? What is the alternative hypothesis? What is the level of significance? 7) Use Tools - Data…
- A researcher used a sample of n = 25 individuals to determine whether they are any preferences between five new designs for a smart phone. If the data produce a chi-square statistic of χ 2 = 10.00 what decision should the researcher make? a. There is a significant preference at both α = .05 and α = .01. b. There is no significant preference at α = .05 but there is at α = .01. c. There is a significant preference at α = .05 but not at α = .01. d. There is no significant preference at either α = .05 or α = .01.The following is a two-way table showing preferences for an award (A, B, C) by gender for the students sampled in survey. Test whether the data indicate there is some association between gender and preferred award. A B C Total Female 20 76 73 169 Male 11 73 109 193 Total 31 149 182 362 Chi-square statistic=_____________ p-value= _________ Conclusion: (reject or do not reject H0) Does the test indicate an association between gender and preferred award? (yes/no)In a surevey, respondents are also asked how many times they have been to theatres in the last 12 months. The following table shows how the frequency of participation preference is distributed across gender. Never Once Two or more Three or more Female 128 43 35 28 Male 112 40 24 20 Q1. What is the conditional percentage of males who have been at the theatre once in the last 12 months? What is the percentage of people of people who have never been at the theatre?Q2. Are gender and theatre participation dependent or independent? Perform a Chi-squared test of independent and discuss if the assumptions for this test are fulfilled. Report also the degrees of freedom of the Chi-squared distribution and the value of the chi-squared statistics for this test.
- A researcher randomly selected 500 patients in a doctors office and found that 90% of these patients had health insurance. The results of this study, if applied to all residents, are questionable because of: a) selection bias b) response bias c) lack of accuracy d) nonreponse biasThe owner of an ice cream shop claims that 40% of his customers prefer chocolate ice cream, 35% prefer vanilla ice cream, 15% prefer strawberry ice cream, and 10% prefer mint ice cream. One of his employees wishes to test this claim. The employee randomly selects 100 customers and asks them about their preferred ice cream flavor. The following table shows the preference of each of the 100 surveyed respondents. Chocolate vanilla strawberry mint 34 31 25 10 Assuming the requirements for the procedure have been met, which of the following procedures should the employee use to test the owner's claim about his customers' ice cream preferences? - chi-square test for homogeneity -chi-square goodness-of-fit test -chi-square test for independence -one-sample ?‑test for a mean -one-sample ?‑test for a proportion(6) A student surveys some students on campus in the evening and finds that 16 out of 20of the students she interviewed are part time students. She uses the data to estimatethe percentage of all students who are part time. What type of bias is present in hersample?(7) A pollster surveys people at a boxing match, asking them if they had even strucktheir spouse. Of the 32 people surveyed, 30 said no and the other 2 did not respond.What type of bias is in this sample?
