The following data give the heights in centimeters of a group of people. Height in centimeters 178 | 157 152 171 171 149 158 | 166 150 144 167 152 175 153 182 162 152 165 167 166 154 170 154| 162 190 166 156 180 153 166 157 184 161 161 159 152 (a) Construct a stem-and-leaf graph for the given data. (b) Draw a table with the relative frequencies and cumulative frequencies (in percentages) for all class intervals. (c) Construct a histogram for the given data, showing relative frequencies as percentages on the y (vertical) axis. (d) Draw a cumulative frequency polygon for the data. (e) Comment on the skewness of the data.
The following data give the heights in centimeters of a group of people. Height in centimeters 178 | 157 152 171 171 149 158 | 166 150 144 167 152 175 153 182 162 152 165 167 166 154 170 154| 162 190 166 156 180 153 166 157 184 161 161 159 152 (a) Construct a stem-and-leaf graph for the given data. (b) Draw a table with the relative frequencies and cumulative frequencies (in percentages) for all class intervals. (c) Construct a histogram for the given data, showing relative frequencies as percentages on the y (vertical) axis. (d) Draw a cumulative frequency polygon for the data. (e) Comment on the skewness of the data.

MATLAB: An Introduction with Applications
6th Edition
ISBN:9781119256830
Author:Amos Gilat
Publisher:Amos Gilat
Chapter1: Starting With Matlab
Section: Chapter Questions
Problem 1P

Related questions
Question
In (b), (c) and (d), use class intervals of width 10 centimeters, starting from 140 cm.
Transcribed Image Text:Question 1
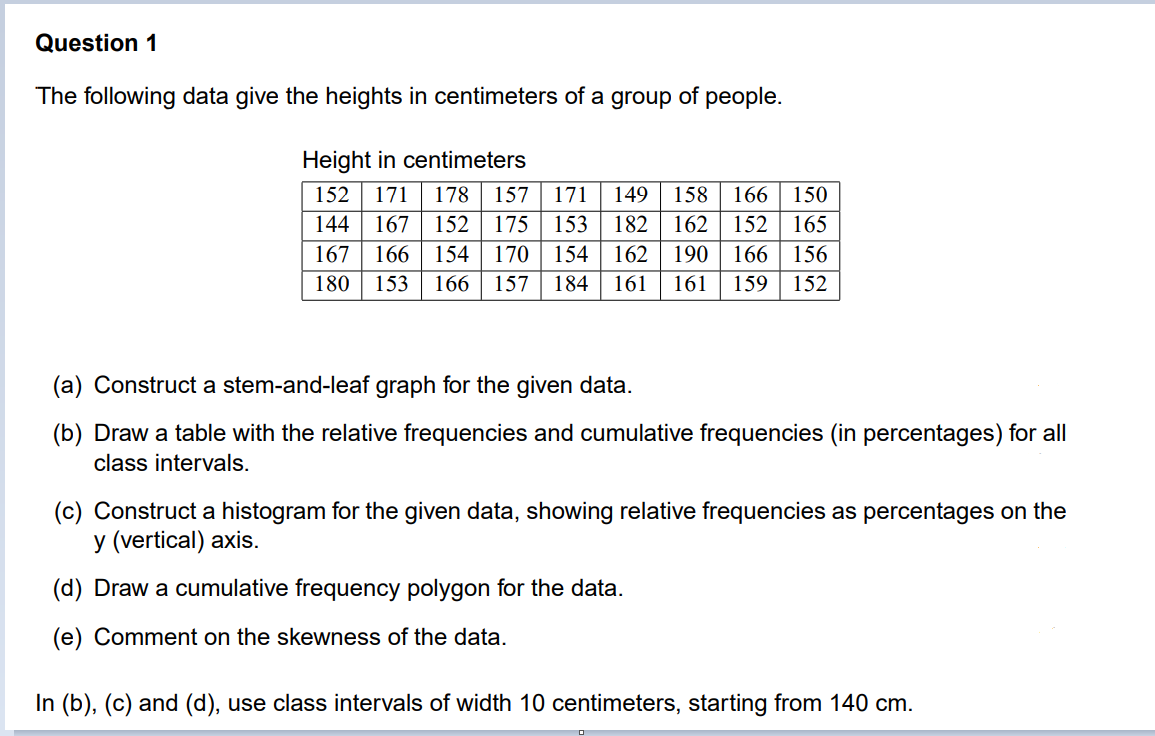
The following data give the heights in centimeters of a group of people.
Height in centimeters
152
171
178
157
171
149
158
166
150
175 153
162 152| 165
190 | 166
144
167
152
182
167
166
154
170
154
162
156
180
153
166
157
184
161
161
159
152
(a) Construct a stem-and-leaf graph for the given data.
(b) Draw a table with the relative frequencies and cumulative frequencies (in percentages) for all
class intervals.
(c) Construct a histogram for the given data, showing relative frequencies as percentages on the
y (vertical) axis.
(d) Draw a cumulative frequency polygon for the data.
(e) Comment on the skewness of the data.
In (b), (c) and (d), use class intervals of width 10 centimeters, starting from 140 cm.
Expert Solution
This question has been solved!
Explore an expertly crafted, step-by-step solution for a thorough understanding of key concepts.

Step by step
Solved in 5 steps with 3 images

Knowledge Booster


Learn more about
Need a deep-dive on the concept behind this application? Look no further. Learn more about this topic, statistics and related others by exploring similar questions and additional content below.Recommended textbooks for you
MATLAB: An Introduction with Applications
Statistics
ISBN:
9781119256830
Author:
Amos Gilat
Publisher:
John Wiley & Sons Inc

Probability and Statistics for Engineering and th…
Statistics
ISBN:
9781305251809
Author:
Jay L. Devore
Publisher:
Cengage Learning

Statistics for The Behavioral Sciences (MindTap C…
Statistics
ISBN:
9781305504912
Author:
Frederick J Gravetter, Larry B. Wallnau
Publisher:
Cengage Learning
MATLAB: An Introduction with Applications
Statistics
ISBN:
9781119256830
Author:
Amos Gilat
Publisher:
John Wiley & Sons Inc
Probability and Statistics for Engineering and th…
Statistics
ISBN:
9781305251809
Author:
Jay L. Devore
Publisher:
Cengage Learning
Statistics for The Behavioral Sciences (MindTap C…
Statistics
ISBN:
9781305504912
Author:
Frederick J Gravetter, Larry B. Wallnau
Publisher:
Cengage Learning

Elementary Statistics: Picturing the World (7th E…
Statistics
ISBN:
9780134683416
Author:
Ron Larson, Betsy Farber
Publisher:
PEARSON

The Basic Practice of Statistics
Statistics
ISBN:
9781319042578
Author:
David S. Moore, William I. Notz, Michael A. Fligner
Publisher:
W. H. Freeman

Introduction to the Practice of Statistics
Statistics
ISBN:
9781319013387
Author:
David S. Moore, George P. McCabe, Bruce A. Craig
Publisher:
W. H. Freeman