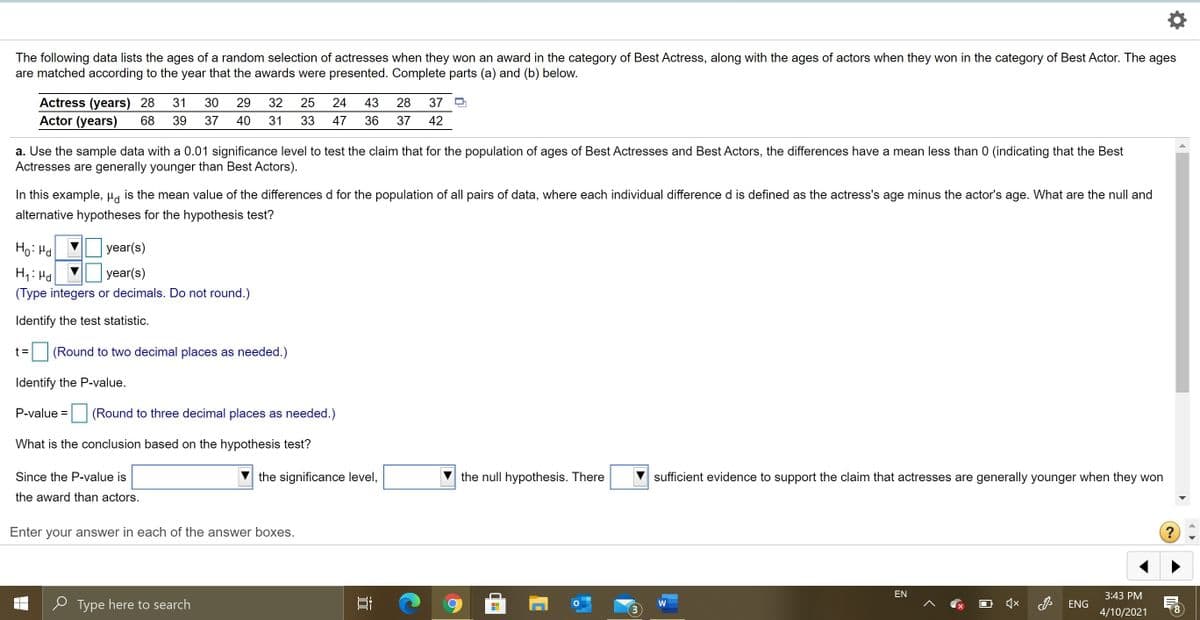
The following data lists the ages of a random selection of actresses when they won an award in the category of Best Actress, along with the ages of actors when they won in the category of Best Actor. The ages are matched according to the year that the awards were presented. Complete parts (a) and (b) below. Actress (years) 28 31 Actor (years) 30 29 32 25 24 43 28 37 D 68 39 37 40 31 33 47 36 37 42 a. Use the sample data with a 0.01 significance level to test the claim that for the population of ages of Best Actresses and Best Actors, the differences have a mean less than 0 (indicating that the Best Actresses are generally younger than Best Actors). In this example, Ha is the mean value of the differences d for the population of all pairs of data, where each individual difference d is defined as the actress's age minus the actor's age. What are the null and alternative hypotheses for the hypothesis test? V year(s) Ho: Hd H,: Ha VU year(s) (Type integers or decimals. Do not round.) Identify the test statistic. t= (Round to two decimal places as needed.) Identify the P-value, P-value = (Round to three decimal places as needed.) What is the conclusion based on the hypothesis test? Since the P-value is the significance level, the null hypothesis. There sufficient evidence to support the claim that actresses are generally younger when they won the award than actors. Enter your answer in each of the answer boxes.


Inverse Normal Distribution
The method used for finding the corresponding z-critical value in a normal distribution using the known probability is said to be an inverse normal distribution. The inverse normal distribution is a continuous probability distribution with a family of two parameters.
Mean, Median, Mode
It is a descriptive summary of a data set. It can be defined by using some of the measures. The central tendencies do not provide information regarding individual data from the dataset. However, they give a summary of the data set. The central tendency or measure of central tendency is a central or typical value for a probability distribution.
Z-Scores
A z-score is a unit of measurement used in statistics to describe the position of a raw score in terms of its distance from the mean, measured with reference to standard deviation from the mean. Z-scores are useful in statistics because they allow comparison between two scores that belong to different normal distributions.


Trending now
This is a popular solution!

Step by step
Solved in 3 steps with 6 images


