The table below shows the scores of a group of students on a 10-point quiz. Test Score Frequency 3 4. 1 6. 1. 7 3 8 4 10 2 The mean score on this test is: The median score on this test is: Question Help: Video 1 D Video 2 Submit Question
The table below shows the scores of a group of students on a 10-point quiz. Test Score Frequency 3 4. 1 6. 1. 7 3 8 4 10 2 The mean score on this test is: The median score on this test is: Question Help: Video 1 D Video 2 Submit Question

Glencoe Algebra 1, Student Edition, 9780079039897, 0079039898, 2018
18th Edition
ISBN:9780079039897
Author:Carter
Publisher:Carter
Chapter10: Statistics
Section10.5: Comparing Sets Of Data
Problem 1GP

Related questions
Question
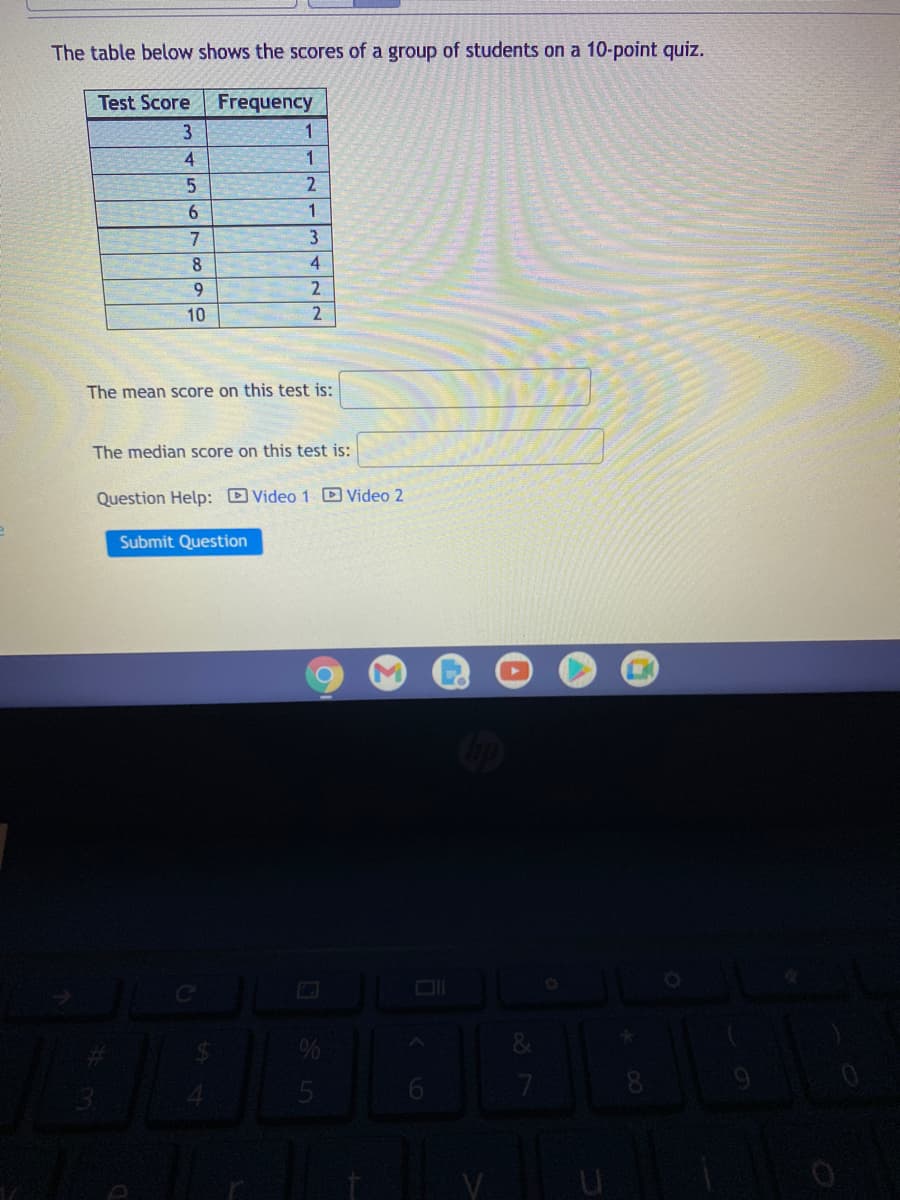
Transcribed Image Text:The table below shows the scores of a group of students on a 10-point quiz.
Test Score
Frequency
3
4
1
6.
7
8
4
9.
2
10
The mean score on this test is:
The median score on this test is:
Question Help: Video 1 D Video 2
Submit Question
7
Expert Solution
This question has been solved!
Explore an expertly crafted, step-by-step solution for a thorough understanding of key concepts.

Step by step
Solved in 3 steps

Recommended textbooks for you
Glencoe Algebra 1, Student Edition, 9780079039897…
Algebra
ISBN:
9780079039897
Author:
Carter
Publisher:
McGraw Hill
Glencoe Algebra 1, Student Edition, 9780079039897…
Algebra
ISBN:
9780079039897
Author:
Carter
Publisher:
McGraw Hill