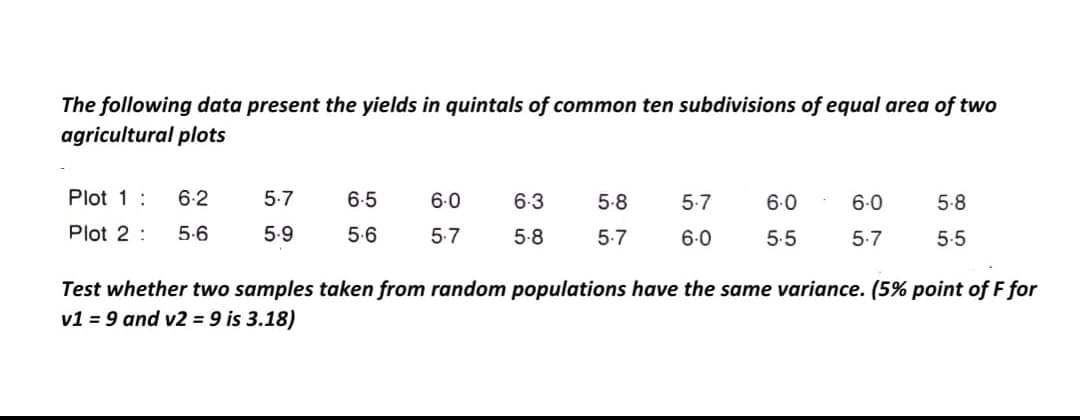
The following data present the yields in quintals of common ten subdivisions of equal area of two agricultural plots Plot 1: 6.2 5.7 6.5 6.0 6.3 5-8 5-7 6.0 6.0 5.8 Plot 2 : 5.6 5.9 5.6 5.7 5-8 5-7 6-0 5.5 5.7 5-5 Test whether two samples taken from random populations have the same variance. (5% point of F for v1 = 9 and v2 = 9 is 3.18)
The following data present the yields in quintals of common ten subdivisions of equal area of two agricultural plots Plot 1: 6.2 5.7 6.5 6.0 6.3 5-8 5-7 6.0 6.0 5.8 Plot 2 : 5.6 5.9 5.6 5.7 5-8 5-7 6-0 5.5 5.7 5-5 Test whether two samples taken from random populations have the same variance. (5% point of F for v1 = 9 and v2 = 9 is 3.18)

Glencoe Algebra 1, Student Edition, 9780079039897, 0079039898, 2018
18th Edition
ISBN:9780079039897
Author:Carter
Publisher:Carter
Chapter10: Statistics
Section10.4: Distributions Of Data
Problem 19PFA

Related questions
Question
Transcribed Image Text:The following data present the yields in quintals of common ten subdivisions of equal area of two
agricultural plots
Plot 1:
6.2
5.7
6-5
6-0
6-3
5-8
5-7
6.0
6.0
5-8
Plot 2 :
5.6
5-9
5-6
5-7
5-8
5-7
6.0
5.5
5.7
5.5
Test whether two samples taken from random populations have the same variance. (5% point of F for
v1 = 9 and v2 = 9 is 3.18)
Expert Solution
This question has been solved!
Explore an expertly crafted, step-by-step solution for a thorough understanding of key concepts.

This is a popular solution!

Trending now
This is a popular solution!

Step by step
Solved in 2 steps with 2 images

Recommended textbooks for you
Glencoe Algebra 1, Student Edition, 9780079039897…
Algebra
ISBN:
9780079039897
Author:
Carter
Publisher:
McGraw Hill
Glencoe Algebra 1, Student Edition, 9780079039897…
Algebra
ISBN:
9780079039897
Author:
Carter
Publisher:
McGraw Hill