The following data presents the productivity scores of 10 workers before and after a certain training program designed to improve productivity. Higher scores indicate better productivity. Worker 3 4 7 8 10 Before 95 97 105 94 103 97 98 95 100 95 After 105 11 111 106 106 104 105 102 106 102
The following data presents the productivity scores of 10 workers before and after a certain training program designed to improve productivity. Higher scores indicate better productivity. Worker 3 4 7 8 10 Before 95 97 105 94 103 97 98 95 100 95 After 105 11 111 106 106 104 105 102 106 102

A First Course in Probability (10th Edition)
10th Edition
ISBN:9780134753119
Author:Sheldon Ross
Publisher:Sheldon Ross
Chapter1: Combinatorial Analysis
Section: Chapter Questions
Problem 1.1P: a. How many different 7-place license plates are possible if the first 2 places are for letters and...

Related questions
Question
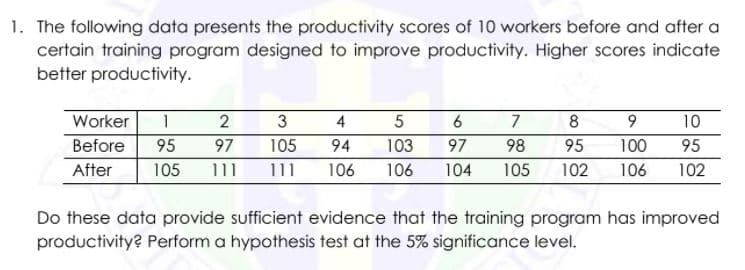
Transcribed Image Text:1. The following data presents the productivity scores of 10 workers before and after a
certain training program designed to improve productivity. Higher scores indicate
better productivity.
Worker
3
4
5
7
8
10
Before
95
97
105
94
103
97
98
95
100
95
After
105
111
111
106
106
104
105
102
106
102
Do these data provide sufficient evidence that the training program has improved
productivity? Perform a hypothesis test at the 5% significance level.
Expert Solution
This question has been solved!
Explore an expertly crafted, step-by-step solution for a thorough understanding of key concepts.

This is a popular solution!

Trending now
This is a popular solution!

Step by step
Solved in 2 steps with 1 images

Recommended textbooks for you
A First Course in Probability (10th Edition)
Probability
ISBN:
9780134753119
Author:
Sheldon Ross
Publisher:
PEARSON

A First Course in Probability (10th Edition)
Probability
ISBN:
9780134753119
Author:
Sheldon Ross
Publisher:
PEARSON