The following data represent the daily emission (in units of 10 kg) of a pollutant from an industrial plant. 8.5 12.4 7.5 13.6 10.3 9.6 8.2 7.9 6.4 7.8 8.0 10.1 9.3 Calculate the sample range, median value, and the first and third quartiles. Sketch the box plot for the data. Calculate the sample mean, standard deviation, and skewness. 2.
The following data represent the daily emission (in units of 10 kg) of a pollutant from an industrial plant. 8.5 12.4 7.5 13.6 10.3 9.6 8.2 7.9 6.4 7.8 8.0 10.1 9.3 Calculate the sample range, median value, and the first and third quartiles. Sketch the box plot for the data. Calculate the sample mean, standard deviation, and skewness. 2.

Glencoe Algebra 1, Student Edition, 9780079039897, 0079039898, 2018
18th Edition
ISBN:9780079039897
Author:Carter
Publisher:Carter
Chapter10: Statistics
Section10.4: Distributions Of Data
Problem 19PFA

Related questions
Question
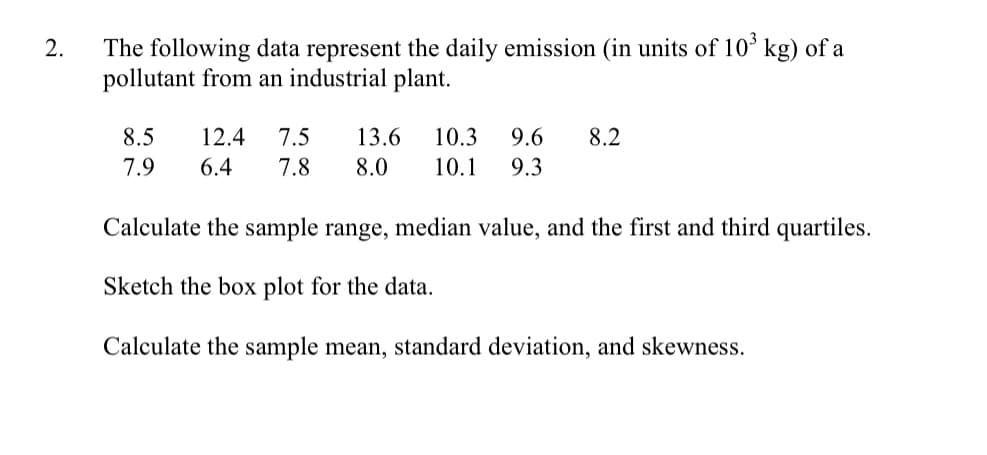
Transcribed Image Text:The following data represent the daily emission (in units of 10ʻ kg) of a
pollutant from an industrial plant.
8.5
12.4
7.5
13.6
10.3
9.6
8.2
7.9
6.4
7.8
8.0
10.1
9.3
Calculate the sample range, median value, and the first and third quartiles.
Sketch the box plot for the data.
Calculate the sample mean, standard deviation, and skewness.
2.
Expert Solution
This question has been solved!
Explore an expertly crafted, step-by-step solution for a thorough understanding of key concepts.

Step by step
Solved in 4 steps with 1 images

Recommended textbooks for you
Glencoe Algebra 1, Student Edition, 9780079039897…
Algebra
ISBN:
9780079039897
Author:
Carter
Publisher:
McGraw Hill
Glencoe Algebra 1, Student Edition, 9780079039897…
Algebra
ISBN:
9780079039897
Author:
Carter
Publisher:
McGraw Hill