The following data represent the duration of eruptions (in seconds) for a random sample of 10 eruptions of the "Old Faithful" geyser in Yellowstone National Park. 105 119 97 108 125 118 88 107 97 113 a. Assuming all of the necessary conditions are satisfied, create a 96% confidence interval for the mean/average duration of all of Old Faithful's eruptions. (To show your work: Write down which calculator/program you are using and what values you are entering into the calculator.) b. Briefly describe the meaning of your interval from part (b). c. In general, if the size of the sample is increased, will the margin of error become larger, smaller, or stay approximately the same?
The following data represent the duration of eruptions (in seconds) for a random sample of 10 eruptions of the "Old Faithful" geyser in Yellowstone National Park. 105 119 97 108 125 118 88 107 97 113 a. Assuming all of the necessary conditions are satisfied, create a 96% confidence interval for the mean/average duration of all of Old Faithful's eruptions. (To show your work: Write down which calculator/program you are using and what values you are entering into the calculator.) b. Briefly describe the meaning of your interval from part (b). c. In general, if the size of the sample is increased, will the margin of error become larger, smaller, or stay approximately the same?

MATLAB: An Introduction with Applications
6th Edition
ISBN:9781119256830
Author:Amos Gilat
Publisher:Amos Gilat
Chapter1: Starting With Matlab
Section: Chapter Questions
Problem 1P

Related questions
Topic Video
Question
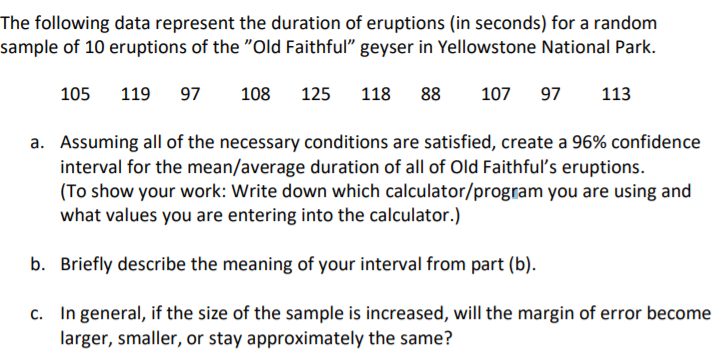
Transcribed Image Text:The following data represent the duration of eruptions (in seconds) for a random
sample of 10 eruptions of the "Old Faithful" geyser in Yellowstone National Park.
105
119
97
108
125
118
88
107
97
113
a. Assuming all of the necessary conditions are satisfied, create a 96% confidence
interval for the mean/average duration of all of Old Faithful's eruptions.
(To show your work: Write down which calculator/program you are using and
what values you are entering into the calculator.)
b. Briefly describe the meaning of your interval from part (b).
c. In general, if the size of the sample is increased, will the margin of error become
larger, smaller, or stay approximately the same?
Expert Solution
This question has been solved!
Explore an expertly crafted, step-by-step solution for a thorough understanding of key concepts.

This is a popular solution!

Trending now
This is a popular solution!

Step by step
Solved in 3 steps with 2 images

Knowledge Booster


Learn more about
Need a deep-dive on the concept behind this application? Look no further. Learn more about this topic, statistics and related others by exploring similar questions and additional content below.Recommended textbooks for you
MATLAB: An Introduction with Applications
Statistics
ISBN:
9781119256830
Author:
Amos Gilat
Publisher:
John Wiley & Sons Inc

Probability and Statistics for Engineering and th…
Statistics
ISBN:
9781305251809
Author:
Jay L. Devore
Publisher:
Cengage Learning

Statistics for The Behavioral Sciences (MindTap C…
Statistics
ISBN:
9781305504912
Author:
Frederick J Gravetter, Larry B. Wallnau
Publisher:
Cengage Learning
MATLAB: An Introduction with Applications
Statistics
ISBN:
9781119256830
Author:
Amos Gilat
Publisher:
John Wiley & Sons Inc
Probability and Statistics for Engineering and th…
Statistics
ISBN:
9781305251809
Author:
Jay L. Devore
Publisher:
Cengage Learning
Statistics for The Behavioral Sciences (MindTap C…
Statistics
ISBN:
9781305504912
Author:
Frederick J Gravetter, Larry B. Wallnau
Publisher:
Cengage Learning

Elementary Statistics: Picturing the World (7th E…
Statistics
ISBN:
9780134683416
Author:
Ron Larson, Betsy Farber
Publisher:
PEARSON

The Basic Practice of Statistics
Statistics
ISBN:
9781319042578
Author:
David S. Moore, William I. Notz, Michael A. Fligner
Publisher:
W. H. Freeman

Introduction to the Practice of Statistics
Statistics
ISBN:
9781319013387
Author:
David S. Moore, George P. McCabe, Bruce A. Craig
Publisher:
W. H. Freeman