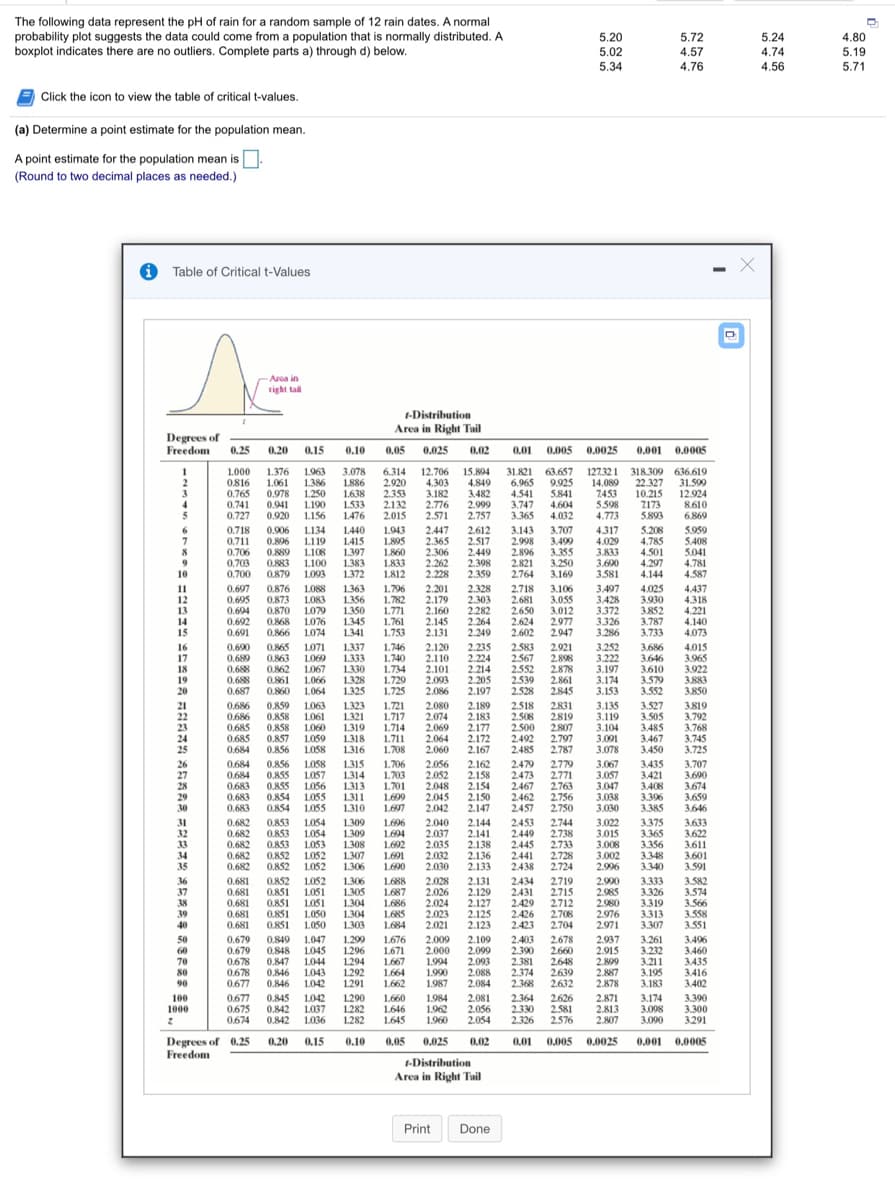
The following data represent the pH of rain for a random sample of 12 rain dates, A normal probability plot sggests the data could come from a population that is pormaly boxplot indicates there are no outliers. Complete parts a) through d) belowany distributed. A A Click the icon to view the table of critical t-values. (a) Determine a point estimate for the population mean. A point estimate for the population mean isO (Round to two decimal places as needed.) 6 Table of Critical t-Values -Distribution Area in Rioht Ta Degrees of Freedom 0,2s 0.20 0.15 0.10 0.05 0.025 0 0.01 0.005 0.0025 0,001 0,0005 0765 0.975 001 0.005 0.0025 0.001 0.0005 Degrees of 0,25 0,20 015 0.10 Freedom 0,02 -Distribution Area in Right Tail 54 2222 N17 7 M R 灵ま出为志 322 222 2222 2 77 inicicic ciciici sici icici c icicicN sicicirici sic cicic Ncicici i sicici さ全望金会主 参蒙 的对高育 SES 生 土 色 8S 列 器刘M mm wmwww 尚www w的邮似吻 巻 3222 22~2N 222 22 2222 222e ~ 2 2222 2222 222 2222 2111i 等 功:


Inverse Normal Distribution
The method used for finding the corresponding z-critical value in a normal distribution using the known probability is said to be an inverse normal distribution. The inverse normal distribution is a continuous probability distribution with a family of two parameters.
Mean, Median, Mode
It is a descriptive summary of a data set. It can be defined by using some of the measures. The central tendencies do not provide information regarding individual data from the dataset. However, they give a summary of the data set. The central tendency or measure of central tendency is a central or typical value for a probability distribution.
Z-Scores
A z-score is a unit of measurement used in statistics to describe the position of a raw score in terms of its distance from the mean, measured with reference to standard deviation from the mean. Z-scores are useful in statistics because they allow comparison between two scores that belong to different normal distributions.

Step by step
Solved in 2 steps


