Listed below are the numbers of years that archbishops and monarchs in a certain country lived after their election or coronation. Assume that the two samples are independent simple random samples selected from normally distributed populations. Do not assume that the population standard deviations are equal. Use a 0.05 significance level to test the claim that the mean longevity for archbishops is less than the mean for monarchs after coronation. All measurements are in years. A Click the icon to view the table of longevities of archbishops and monarchs. D What are the null and alternative hypotheses? Assume that population 1 consists of the longevity of archbishops and population 2 consists of the longevity of monarchs. O B. Ho: H1 = H2 H1: H1 H2 A. Ho: H1 =42 Hy:Hq H2 O D. Ho: H1 H2 H4: H1 > H2 The test statistic is - 1.35. (Round to two decimal places as needed.) The P-value is (Round to three decimal places as needed.)
Listed below are the numbers of years that archbishops and monarchs in a certain country lived after their election or coronation. Assume that the two samples are independent simple random samples selected from normally distributed populations. Do not assume that the population standard deviations are equal. Use a 0.05 significance level to test the claim that the mean longevity for archbishops is less than the mean for monarchs after coronation. All measurements are in years. A Click the icon to view the table of longevities of archbishops and monarchs. D What are the null and alternative hypotheses? Assume that population 1 consists of the longevity of archbishops and population 2 consists of the longevity of monarchs. O B. Ho: H1 = H2 H1: H1 H2 A. Ho: H1 =42 Hy:Hq H2 O D. Ho: H1 H2 H4: H1 > H2 The test statistic is - 1.35. (Round to two decimal places as needed.) The P-value is (Round to three decimal places as needed.)

Glencoe Algebra 1, Student Edition, 9780079039897, 0079039898, 2018
18th Edition
ISBN:9780079039897
Author:Carter
Publisher:Carter
Chapter10: Statistics
Section10.4: Distributions Of Data
Problem 19PFA

Related questions
Question
100%
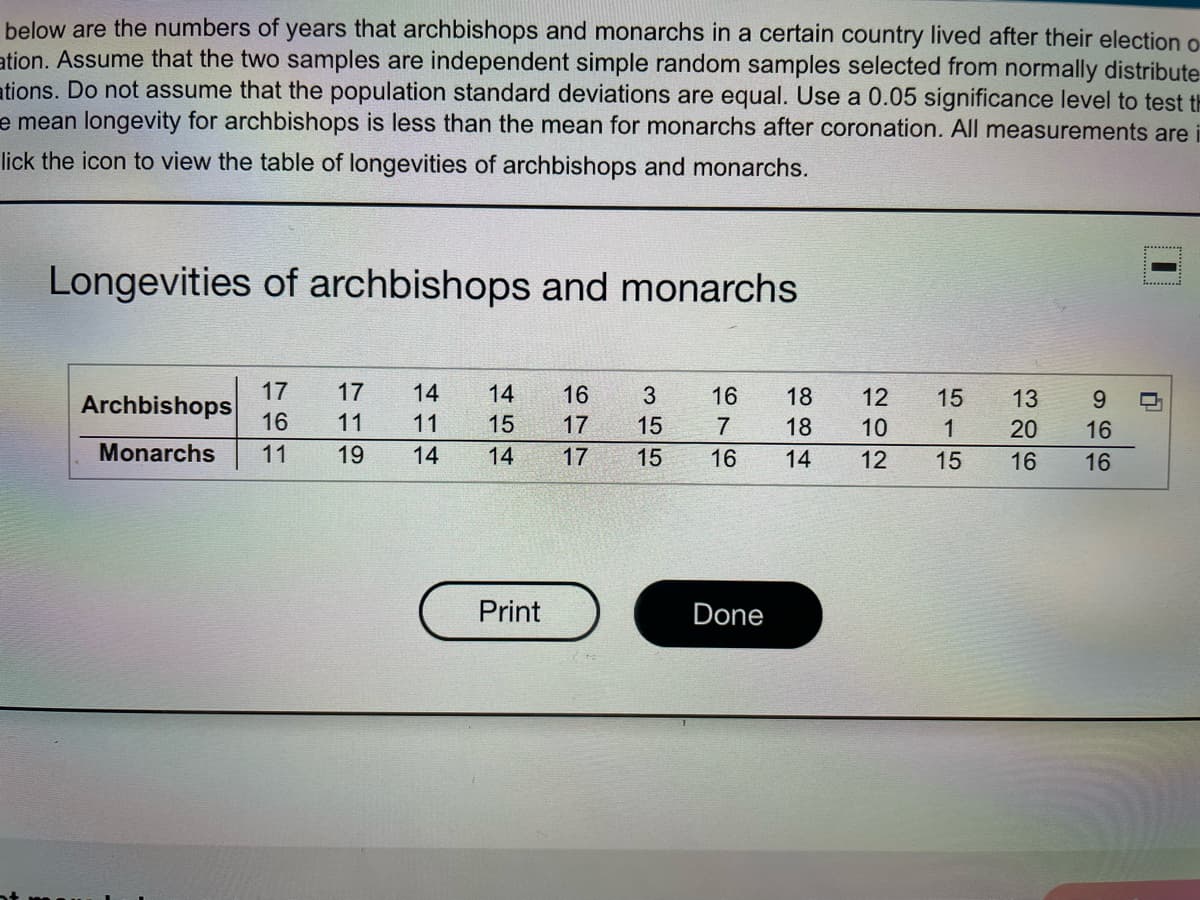
Transcribed Image Text:below are the numbers of years that archbishops and monarchs in a certain country lived after their election o
ation. Assume that the two samples are independent simple random samples selected from normally distribute
ations. Do not assume that the population standard deviations are equal. Use a 0.05 significance level to test th
e mean longevity for archbishops is less than the mean for monarchs after coronation. All measurements are
lick the icon to view the table of longevities of archbishops and monarchs.
Longevities of archbishops and monarchs
17
Archbishops
17
14
16
3.
16
18
12
13
9.
16
11
11
15
17
7
18
10
20
16
Monarchs
11
19
14
14
17
15
16
14
12
15
16
Print
Done
454
65
115
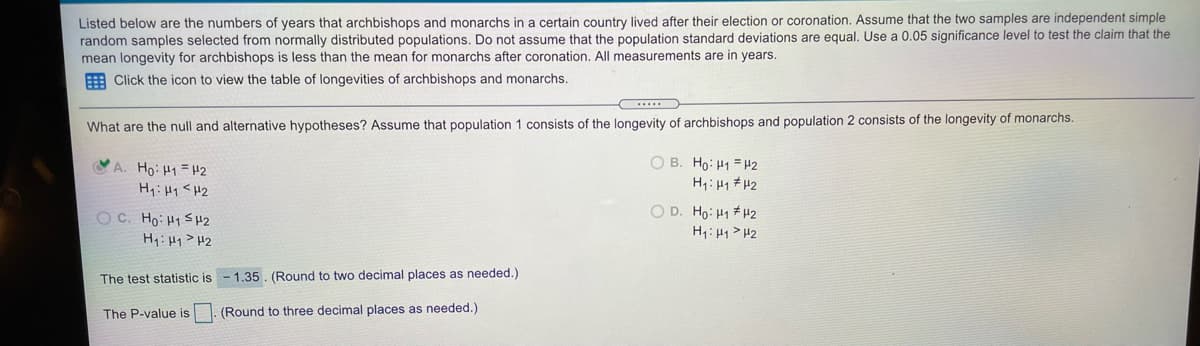
Transcribed Image Text:Listed below are the numbers of years that archbishops and monarchs in a certain country lived after their election or coronation. Assume that the two samples are independent simple
random samples selected from normally distributed populations. Do not assume that the population standard deviations are equal. Use a 0.05 significance level to test the claim that the
mean longevity for archbishops is less than the mean for monarchs after coronation. All measurements are in years.
E Click the icon to view the table of longevities of archbishops and monarchs.
What are the null and alternative hypotheses? Assume that population 1 consists of the longevity of archbishops and population 2 consists of the longevity of monarchs.
O B. Ho: H1 = H2
H1: 41 # H2
YA. Ho: H1 =42
H:Hq<H2
O D. Ho: H1 #42
OC. Ho: H1 SH2
H:Hq> H2
H1:H1>H2
The test statistic is - 1.35. (Round to two decimal places as needed.)
The P-value is
(Round to three decimal places as needed.)
Expert Solution
This question has been solved!
Explore an expertly crafted, step-by-step solution for a thorough understanding of key concepts.

This is a popular solution!

Trending now
This is a popular solution!

Step by step
Solved in 2 steps with 1 images

Recommended textbooks for you
Glencoe Algebra 1, Student Edition, 9780079039897…
Algebra
ISBN:
9780079039897
Author:
Carter
Publisher:
McGraw Hill
Glencoe Algebra 1, Student Edition, 9780079039897…
Algebra
ISBN:
9780079039897
Author:
Carter
Publisher:
McGraw Hill