The following data represent the speed at which a ball was hit (in miles per hour) and the distance it traveled (in feet) for a random sample of home runs in a Major League baseball game in 2018 Complete parts (a) through (1) Click here to view the data Click here to view the critical values of the correlation coefficient. D (a) Find the least-squares regression line treating speed at which the ball was hit as the explanatory variable and distance the ball traveled as the response variable. (Round to three decimal places as needed) (b) Interpret the slope and y-intercept, if appropriate Begin by interpreting the slope OA. The slope of this least-squares regression line says that the distance the ball travels increases by the slope with every 1 mile per hour increase in the speed that the ball was hit OB. The slope of this least-squares regression line shows the distance that the ball would travel when the speed that the ball is hit is zero. OC. The slope of this least-squares regression line shows the increase in the speed that the ball was hit with every 1 foot increase in the distance that the ball was hit OD. Interpreting the slope is not appropriate Now interpret the y-intercept OA. The y-intercept of this least-squares regression line shows the increase in the speed that the ball was hit with every 1 foot increase in the distance that the ball was hit OB. The y-intercept of this least-squares regression line shows the speed that the ball is hit at when the distance that the ball travels is zero. OC. The y-intercept of this least-squares regression line shows the distance that the ball would travel when the speed that the ball is hit is zero OD. Interpreting the y-intercept is not appropriate
The following data represent the speed at which a ball was hit (in miles per hour) and the distance it traveled (in feet) for a random sample of home runs in a Major League baseball game in 2018 Complete parts (a) through (1) Click here to view the data Click here to view the critical values of the correlation coefficient. D (a) Find the least-squares regression line treating speed at which the ball was hit as the explanatory variable and distance the ball traveled as the response variable. (Round to three decimal places as needed) (b) Interpret the slope and y-intercept, if appropriate Begin by interpreting the slope OA. The slope of this least-squares regression line says that the distance the ball travels increases by the slope with every 1 mile per hour increase in the speed that the ball was hit OB. The slope of this least-squares regression line shows the distance that the ball would travel when the speed that the ball is hit is zero. OC. The slope of this least-squares regression line shows the increase in the speed that the ball was hit with every 1 foot increase in the distance that the ball was hit OD. Interpreting the slope is not appropriate Now interpret the y-intercept OA. The y-intercept of this least-squares regression line shows the increase in the speed that the ball was hit with every 1 foot increase in the distance that the ball was hit OB. The y-intercept of this least-squares regression line shows the speed that the ball is hit at when the distance that the ball travels is zero. OC. The y-intercept of this least-squares regression line shows the distance that the ball would travel when the speed that the ball is hit is zero OD. Interpreting the y-intercept is not appropriate

Linear Algebra: A Modern Introduction
4th Edition
ISBN:9781285463247
Author:David Poole
Publisher:David Poole
Chapter7: Distance And Approximation
Section7.3: Least Squares Approximation
Problem 31EQ

Related questions
Question
Practice Pack
Second image is the required data
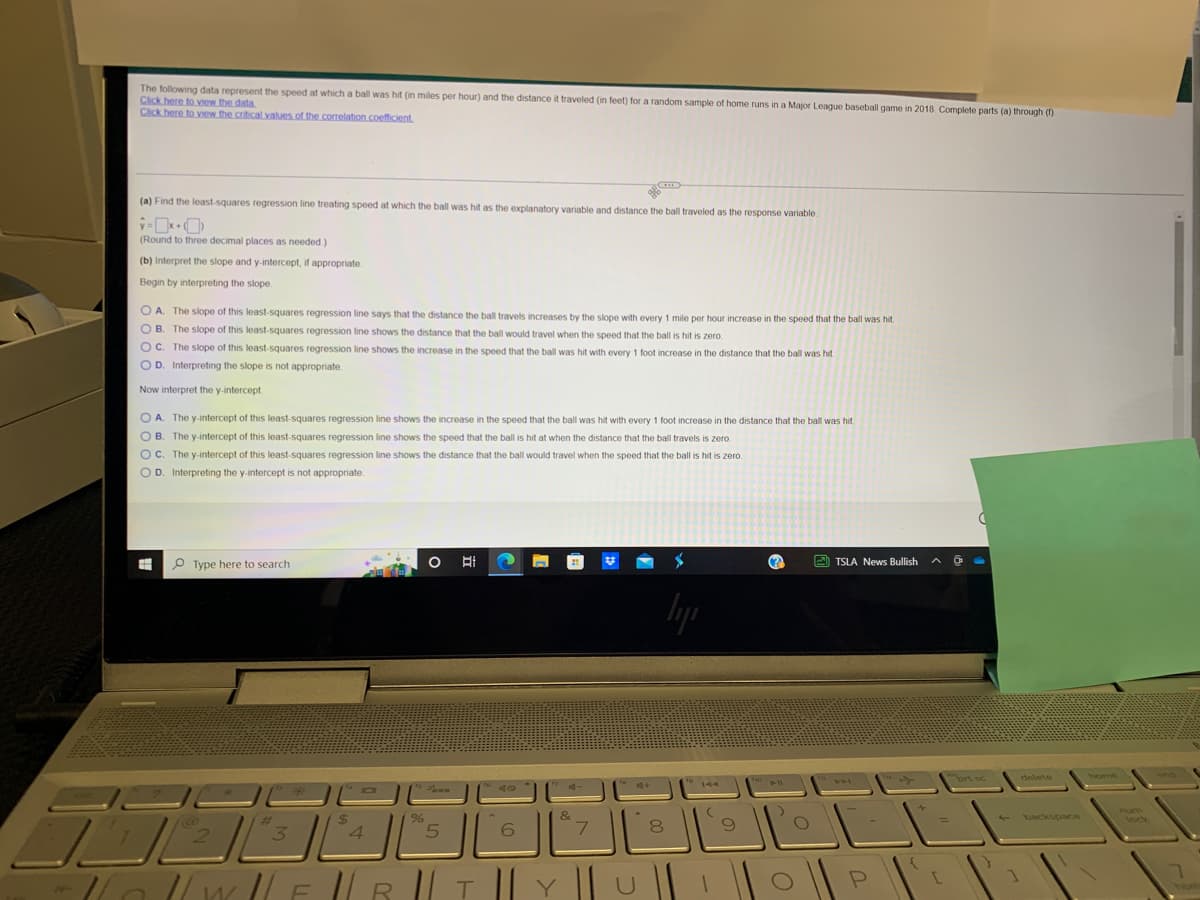
Transcribed Image Text:The following data represent the speed at which a ball was hit (in miles per hour) and the distance it traveled (in feet) for a random sample of home runs in a Major League baseball game in 2018. Complete parts (a) through (1)
Click here to view the data.
Click here to view the critical values of the correlation coefficient,
CD
(a) Find the least-squares regression line treating speed at which the ball was hit as the explanatory variable and distance the ball traveled as the response variable.
ŷ=x+
(Round to three decimal places as needed.)
(b) Interpret the slope and y-intercept, if appropriate.
Begin by interpreting the slope.
OA. The slope of this least-squares regression line says that the distance the ball travels increases by the slope with every 1 mile per hour increase in the speed that the ball was hit.
OB. The slope of this least-squares regression line shows the distance that the ball would travel when the speed that the ball is hit is zero.
OC. The slope of this least-squares regression line shows the increase in the speed that the ball was hit with every 1 foot increase in the distance that the ball was hit.
OD. Interpreting the slope is not appropriate.
Now interpret the y-intercept.
OA. The y-intercept of this least-squares regression line shows the increase in the speed that the ball was hit with every 1 foot increase in the distance that the ball was hit
OB. The y-intercept of this least-squares regression line shows the speed that the ball is hit at when the distance that the ball travels is zero.
OC. The y-intercept of this least-squares regression line shows the distance that the ball would travel when the speed that the ball is hit is zero.
OD. Interpreting the y-intercept is not appropriate.
Type here to search
Ot
#
$
(?)
TSLA News Bullish
liji
19
Pass
40
5
6
8
9
7
3
4
2
JL
"HallWlLERTY || U || |
$
%
&
+
144
(
4-11
اشال
P
=
[
O
J
delete
backspace
1
lock
7
Transcribed Image Text:571335¢erwin=yes
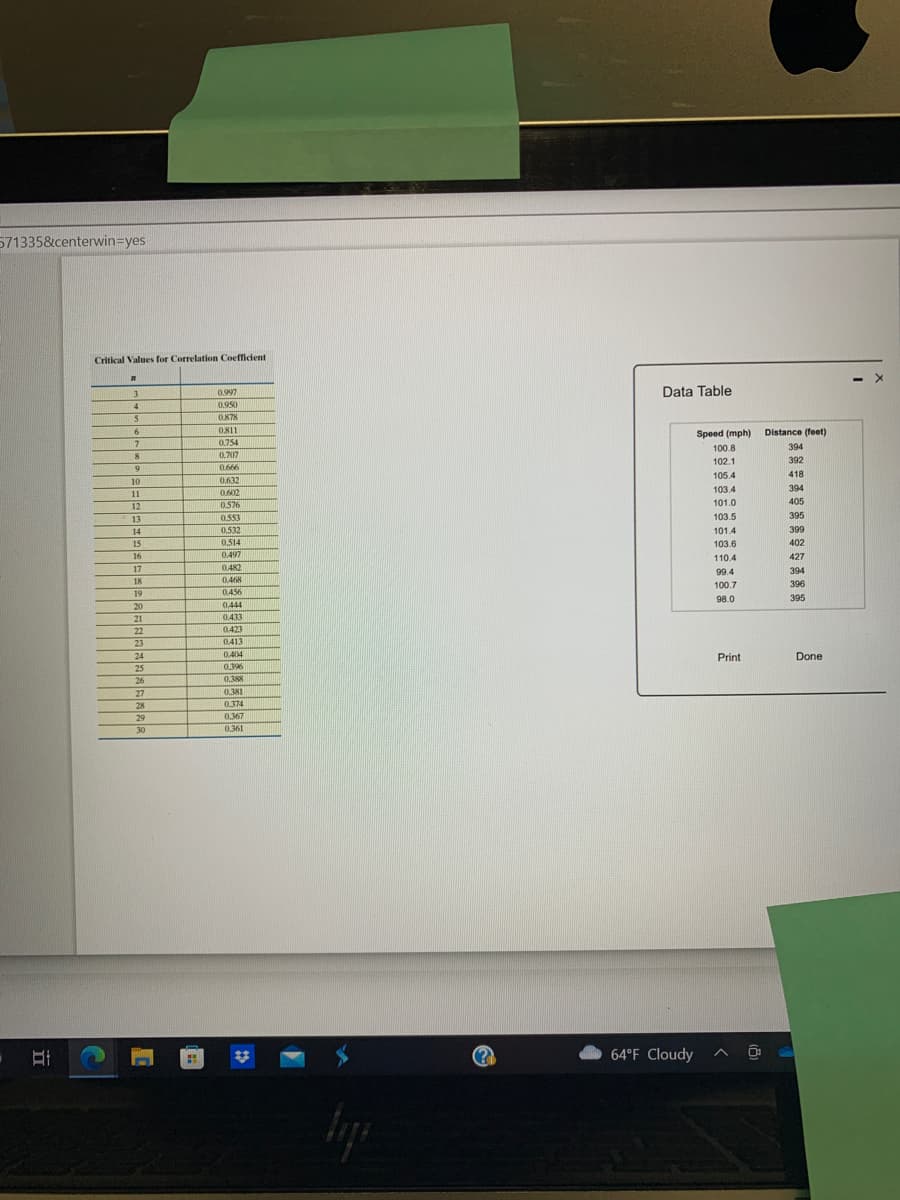
Critical Values for Correlation Coefficient
n
0.997
0.950
0.878
0811
0.754
0.707
0.666
0.632
0.602
0.576
0.553
0.532
0.514
0.497
0.482
0.468
0.456
0.444
0.433
0423
0413
0.404
0.396
0.388
0.381
0.374
0.367
0.361
3
4
5
6
7
8
9
10
11
12
13
14
15
16
17
18
19
20
21
22
23
24
25
26
27
28
29
30
*
hip
Data Table
64°F Cloudy
Speed (mph)
100.8
102.1
105.4
103.4
101.0
103.5
101.4
103.6
110.4
99.4
100.7
98.0
Print
Distance (feet)
394
392
418
394
405
395
399
402
427
394
396
395
Done
Expert Solution
This question has been solved!
Explore an expertly crafted, step-by-step solution for a thorough understanding of key concepts.

This is a popular solution!

Includes step-by-step video

Trending now
This is a popular solution!

Learn your way
Includes step-by-step video

Step by step
Solved in 2 steps with 2 images

Recommended textbooks for you
Linear Algebra: A Modern Introduction
Algebra
ISBN:
9781285463247
Author:
David Poole
Publisher:
Cengage Learning

Glencoe Algebra 1, Student Edition, 9780079039897…
Algebra
ISBN:
9780079039897
Author:
Carter
Publisher:
McGraw Hill

Big Ideas Math A Bridge To Success Algebra 1: Stu…
Algebra
ISBN:
9781680331141
Author:
HOUGHTON MIFFLIN HARCOURT
Publisher:
Houghton Mifflin Harcourt
Linear Algebra: A Modern Introduction
Algebra
ISBN:
9781285463247
Author:
David Poole
Publisher:
Cengage Learning
Glencoe Algebra 1, Student Edition, 9780079039897…
Algebra
ISBN:
9780079039897
Author:
Carter
Publisher:
McGraw Hill
Big Ideas Math A Bridge To Success Algebra 1: Stu…
Algebra
ISBN:
9781680331141
Author:
HOUGHTON MIFFLIN HARCOURT
Publisher:
Houghton Mifflin Harcourt