The following data show the number of hours spent watching television for 10 randomly selected freshmen attending a liberal arts college in the Midwest. Hours of Television Viewed Weekly 17 15 15 17 13 14 18 15 16 11 O Calculate the range, variance, standard deviation, and interquartile range for the sample data. The range for the data set is (Type an integer or a decimal. Do not round.) The sample variance, s, is (Round to two decimal places as needed.) The sample standard deviation, s, is O (Round to two decimal places as needed.) The interquartile range for the data set is (Type an integer or a decimal. Do not round.)
The following data show the number of hours spent watching television for 10 randomly selected freshmen attending a liberal arts college in the Midwest. Hours of Television Viewed Weekly 17 15 15 17 13 14 18 15 16 11 O Calculate the range, variance, standard deviation, and interquartile range for the sample data. The range for the data set is (Type an integer or a decimal. Do not round.) The sample variance, s, is (Round to two decimal places as needed.) The sample standard deviation, s, is O (Round to two decimal places as needed.) The interquartile range for the data set is (Type an integer or a decimal. Do not round.)

Glencoe Algebra 1, Student Edition, 9780079039897, 0079039898, 2018
18th Edition
ISBN:9780079039897
Author:Carter
Publisher:Carter
Chapter10: Statistics
Section10.4: Distributions Of Data
Problem 19PFA

Related questions
Question
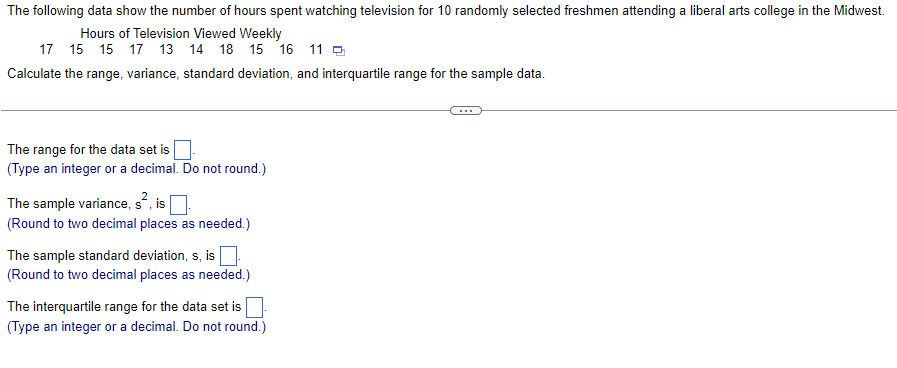
Transcribed Image Text:The following data show the number of hours spent watching television for 10 randomly selected freshmen attending a liberal arts college in the Midwest.
Hours of Television Viewed Weekly
17 15 15 17 13 14 18 15 16 11 O
Calculate the range, variance, standard deviation, and interquartile range for the sample data.
The range for the data set is.
(Type an integer or a decimal. Do not round.)
The sample variance, s“, is
(Round to two decimal places as needed.)
The sample standard deviation, s, is
(Round to two decimal places as needed.)
The interquartile range for the data set is
(Type an integer or a decimal. Do not round.)
Expert Solution
This question has been solved!
Explore an expertly crafted, step-by-step solution for a thorough understanding of key concepts.

Step by step
Solved in 2 steps with 1 images

Recommended textbooks for you
Glencoe Algebra 1, Student Edition, 9780079039897…
Algebra
ISBN:
9780079039897
Author:
Carter
Publisher:
McGraw Hill
Glencoe Algebra 1, Student Edition, 9780079039897…
Algebra
ISBN:
9780079039897
Author:
Carter
Publisher:
McGraw Hill