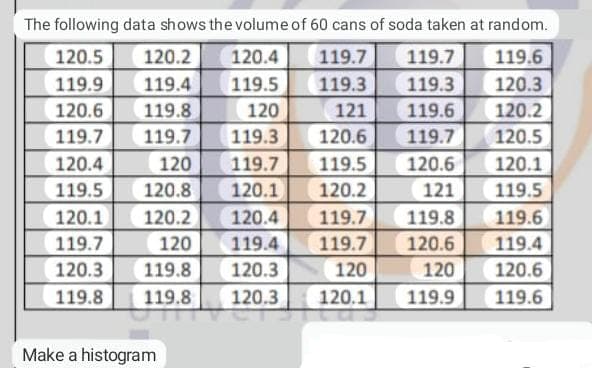
The following data shows the volume of 60 cans of soda taken at random. 120.5 120.2 120.4 119.7 119.7 119.6 119.9 119.4 119.5 119.3 119.3 120.3 120.6 119.8 120 121 119.6 120.2 119.7 119.7 119.3 120.6 119.7 120.5 120.4 120 119.7 119.5 120.6 120.1 119.5 120.8 120.1 120.2 121 119.5 120.1 120.2 120.4 119.7 119.8 119.6 119.7 120 119.4 119.7 120.6 119.4 120.3 119.8 120.3 120 120 120.6 119.8 119.8 120.3 120.1 119.9 119.6
The following data shows the volume of 60 cans of soda taken at random. 120.5 120.2 120.4 119.7 119.7 119.6 119.9 119.4 119.5 119.3 119.3 120.3 120.6 119.8 120 121 119.6 120.2 119.7 119.7 119.3 120.6 119.7 120.5 120.4 120 119.7 119.5 120.6 120.1 119.5 120.8 120.1 120.2 121 119.5 120.1 120.2 120.4 119.7 119.8 119.6 119.7 120 119.4 119.7 120.6 119.4 120.3 119.8 120.3 120 120 120.6 119.8 119.8 120.3 120.1 119.9 119.6

Mathematics For Machine Technology
8th Edition
ISBN:9781337798310
Author:Peterson, John.
Publisher:Peterson, John.
Chapter29: Tolerance, Clearance, And Interference
Section: Chapter Questions
Problem 16A: Spacers are manufactured to the mean dimension and tolerance shown in Figure 29-12. An inspector...

Related questions
Question
make the histogram and the working formula manually
Transcribed Image Text:The following data shows the volume of 60 cans of soda taken at random.
120.5
120.2
120.4
119.7
119.7
119.6
119.9
119.4
119.5
119.3
119.3
120.3
120.6
119.8
120
121
119.6
120.2
119.7
119.7
119.3
120.6
119.7
120.5
120.4
120
119.7
119.5
120.6
120.1
119.5
120.8
120.1
120.2
121
119.5
120.1
120.2
120.4
119.7
119.8
119.6
119.7
120
119.4
119.7
120.6
119.4
120.3
119.8
120.3
120
120
120.6
119.8
120.3
119.8
120.1
119.9
119.6
Make a histogram
Expert Solution
This question has been solved!
Explore an expertly crafted, step-by-step solution for a thorough understanding of key concepts.

Step by step
Solved in 2 steps with 1 images

Recommended textbooks for you
Mathematics For Machine Technology
Advanced Math
ISBN:
9781337798310
Author:
Peterson, John.
Publisher:
Cengage Learning,
Mathematics For Machine Technology
Advanced Math
ISBN:
9781337798310
Author:
Peterson, John.
Publisher:
Cengage Learning,