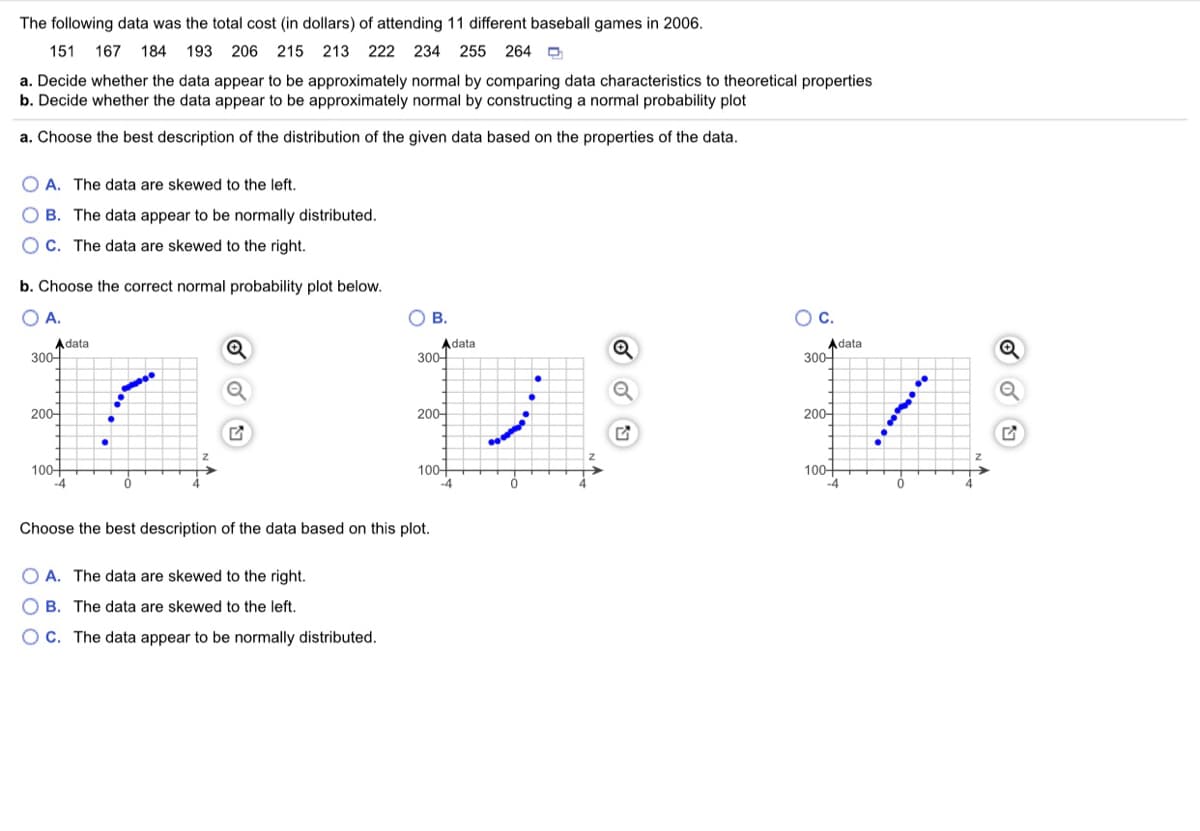
The following data was the total cost (in dollars) of attending 11 different baseball games in 2006. 151 167 184 193 206 215 213 222 234 255 264 D a. Decide whether the data appear to be approximately normal by comparing data characteristics to theoretical properties b. Decide whether the data appear to be approximately normal by constructing a normal probability plot a. Choose the best description of the distribution of the given data based on the properties of the data. O A. The data are skewed to the left. O B. The data appear to be normally distributed. O C. The data are skewed to the right. b. Choose the correct normal probability plot below. O A. O B. Oc. Adata 300어 Adata 300- Adata 300어 200- 200어 200- 100 -4 100- 100- -4 Choose the best description of the data based on this plot. O A. The data are skewed to the right. O B. The data are skewed to the left. OC. The data appear to be normally distributed.
The following data was the total cost (in dollars) of attending 11 different baseball games in 2006. 151 167 184 193 206 215 213 222 234 255 264 D a. Decide whether the data appear to be approximately normal by comparing data characteristics to theoretical properties b. Decide whether the data appear to be approximately normal by constructing a normal probability plot a. Choose the best description of the distribution of the given data based on the properties of the data. O A. The data are skewed to the left. O B. The data appear to be normally distributed. O C. The data are skewed to the right. b. Choose the correct normal probability plot below. O A. O B. Oc. Adata 300어 Adata 300- Adata 300어 200- 200어 200- 100 -4 100- 100- -4 Choose the best description of the data based on this plot. O A. The data are skewed to the right. O B. The data are skewed to the left. OC. The data appear to be normally distributed.

Glencoe Algebra 1, Student Edition, 9780079039897, 0079039898, 2018
18th Edition
ISBN:9780079039897
Author:Carter
Publisher:Carter
Chapter10: Statistics
Section10.4: Distributions Of Data
Problem 19PFA

Related questions
Question
Transcribed Image Text:The following data was the total cost (in dollars) of attending 11 different baseball games in 2006.
151
167 184
193 206 215 213 222 234 255 264 D
a. Decide whether the data appear to be approximately normal by comparing data characteristics to theoretical properties
b. Decide whether the data appear to be approximately normal by constructing a normal probability plot
a. Choose the best description of the distribution of the given data based on the properties of the data.
A. The data are skewed to the left.
O B. The data appear to be normally distributed.
O C. The data are skewed to the right.
b. Choose the correct normal probability plot below.
O A.
OB.
Oc.
Adata
300-
Adata
300-
Q
Adata
300-
200-
200-
200-
100-
100-
100-
Choose the best description of the data based on this plot.
O A. The data are skewed to the right.
O B. The data are skewed to the left.
O C. The data appear to be normally distributed.
Expert Solution
This question has been solved!
Explore an expertly crafted, step-by-step solution for a thorough understanding of key concepts.

This is a popular solution!

Trending now
This is a popular solution!

Step by step
Solved in 3 steps with 2 images

Knowledge Booster


Learn more about
Need a deep-dive on the concept behind this application? Look no further. Learn more about this topic, statistics and related others by exploring similar questions and additional content below.Recommended textbooks for you
Glencoe Algebra 1, Student Edition, 9780079039897…
Algebra
ISBN:
9780079039897
Author:
Carter
Publisher:
McGraw Hill
Glencoe Algebra 1, Student Edition, 9780079039897…
Algebra
ISBN:
9780079039897
Author:
Carter
Publisher:
McGraw Hill