The following equations describe an economy. Y = C+I+ G C = 50 + 0.9(Y - T) I = 100 – 20r (M/P)d Y-2or G = 150 T = 100 M = 2,000 P = 4 From the above list, use the relevant set of equations to derive the LM curve. Graph the LM curve on the same graph you used in part (b).
The following equations describe an economy. Y = C+I+ G C = 50 + 0.9(Y - T) I = 100 – 20r (M/P)d Y-2or G = 150 T = 100 M = 2,000 P = 4 From the above list, use the relevant set of equations to derive the LM curve. Graph the LM curve on the same graph you used in part (b).

Chapter1: Introducing The Economic Way Of Thinking
Section1.A: Applying Graphs To Economics
Problem 20SQ

Related questions

Question
Answer the attached question
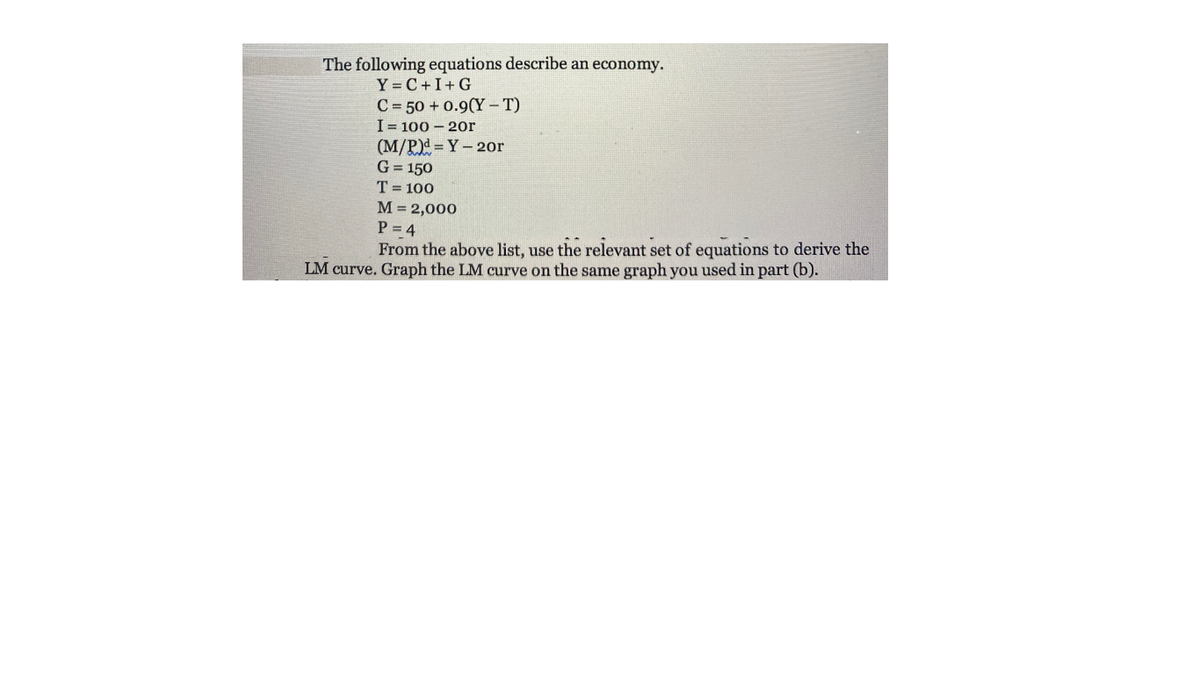
Transcribed Image Text:The following equations describe an economy.
Y = C+I+ G
C = 50 + 0.9(Y - T)
I = 100 – 20r
(M/P)d Y-2or
G = 150
T = 100
M = 2,000
P = 4
From the above list, use the relevant set of equations to derive the
LM curve. Graph the LM curve on the same graph you used in part (b).
Expert Solution
This question has been solved!
Explore an expertly crafted, step-by-step solution for a thorough understanding of key concepts.

This is a popular solution!

Trending now
This is a popular solution!

Step by step
Solved in 2 steps with 1 images

Knowledge Booster


Learn more about
Need a deep-dive on the concept behind this application? Look no further. Learn more about this topic, economics and related others by exploring similar questions and additional content below.Recommended textbooks for you


Managerial Economics: Applications, Strategies an…
Economics
ISBN:
9781305506381
Author:
James R. McGuigan, R. Charles Moyer, Frederick H.deB. Harris
Publisher:
Cengage Learning
