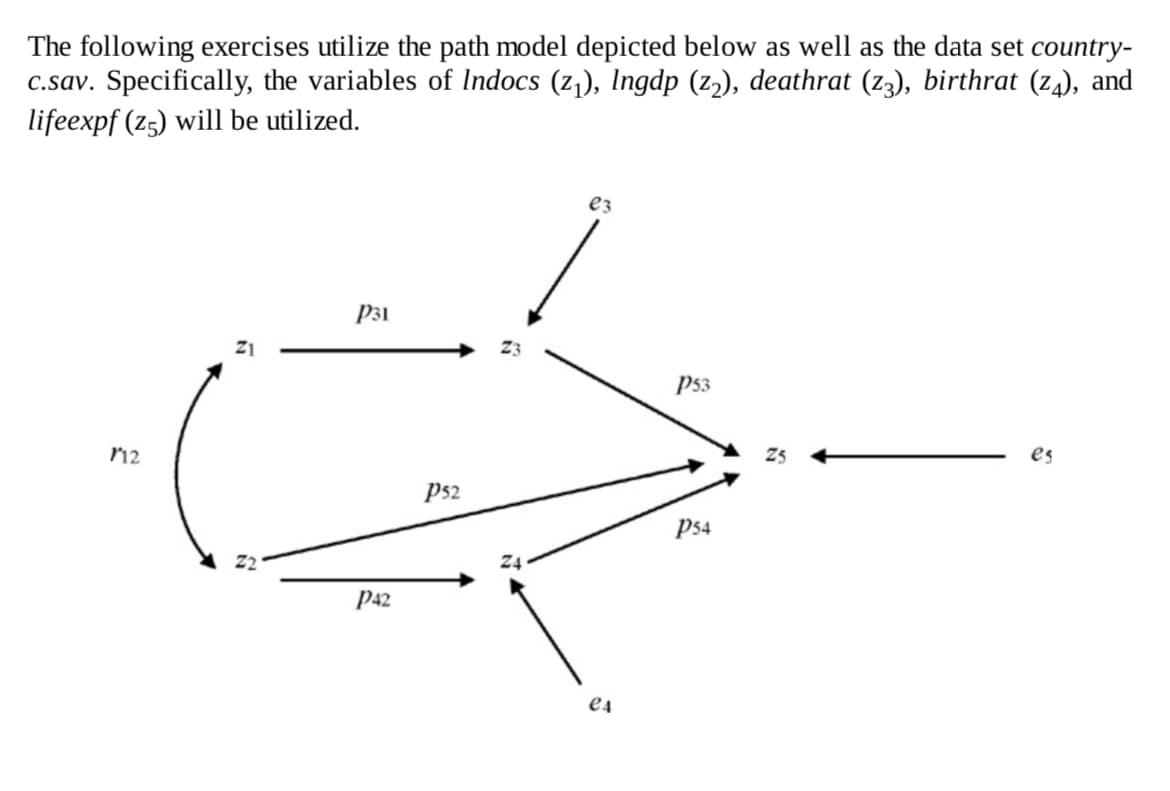
The following exercises utilize the path model depicted below as well as the data set country- c.sav. Specifically, the variables of Indocs (z₁), Ingdp (z2), deathrat (z3), birthrat (z4), and lifeexpf (z5) will be utilized. 112 Z1 S P31 P42 P52 ez e4 P53 P54 ✔ es


Q: 1. Tommy's cab company transports riders using 2 routes. Use the following data to determine the…
A: 1. The data regarding driving time for two routes are given.
Q: plzz help 11) How many words can we build using exactly 4 A's, 4 B's and 4 C's if the first 4…
A:
Q: If a is chosen by the analyst to be .025 and x = 14.15 with 4 degrees of freedom, what is our…
A: Given -: x² statistic =14.15 Degrees of freedom, df = 4
Q: When Mendel conducted his famous genetics experiment with peas, one sample of offspring consisted of…
A: Obtain the 95% confidence interval estimate of the percentage of yellow peas. The 95% confidence…
Q: Since it is a right tailed test, would it be p= 0.1530 or p=0.2230.
A: From the original problem and solution, we get t = 0.3111 df = 12
Q: Find the following: a) state the null and alternative hypotheses b) state the type I & type II…
A: Introduction: Denote p as the true proportion, or true rate at which the dog correctly detected…
Q: Consider the following data. 120, 120, 124, 125, 150, 165, 170, 175, 175, 175, 176, 182, 185, 190,…
A: According to the given information in this question We need to find 90th percentile
Q: Below are the data for 14 US stock market brokerage firms. Do a regression of Satisfaction…
A: Procedure to perform multiple regression analysis using excel: Enter the data of Trade price, speed…
Q: SRS of 1500 first-year college students were asked whether they applied for admission to any other…
A: Note: As per Bartleby guidelines only three sub-parts can be answered. Kindly, resubmit for othe…
Q: The random variable X is normally distributed such that X~N(?,12). It is known that ?(?>32)=0.0618.…
A: Followings are the Explanation of the questionσ Let X be the random variables follows the Normal…
Q: SmithTelecome is a supplier to many brand-name makers of mobile phones. SmithTelecome manufactures…
A: Confidence interval is the range that has two limits and two parts. The two limits are upper and…
Q: You are considering taking a job at a certain company. You find the salaries of 15 people working at…
A: From the above data We are given that the values 32,36,38,38,38,43,44,45,53,55,58,58,60,80,95 Find…
Q: The amounts of nicotine in a certain brand of cigarette are normally distributed with a mean of…
A: Given Mean=0.908 Standard deviations=0.318
Q: Life on Other Planets Forty-six percent of people believe that there is life on other planets in the…
A: Given: P = 0.46 n = 120 X = 48 α = 0.10 Explanation: Test-statistic Z = p^-PP(1-P)n
Q: 9. A bag contains 100 balls numbered 1 to 100. One ball is drawn from the bag. What is the…
A: given data, A beg contains 100 balls numbered 1 to 100sample space :{1,2,...,100}n=100we have to…
Q: When performing statistical inference with a sample of data, if Ho : B; = a, then the t statistic (t…
A: The null hypothesis for the test is given as, H_0: βj=a The null hypothesis states that the slope…
Q: Waiters at a restaurant chain earn an average of $246 per shift (regular pay + tips) with a standard…
A:
Q: a. Is there a significant difference on the ratings of the respondents on Product Line-X11) when…
A: Given information: The tables obtained using SPSS output are given.
Q: A sandwich store rents space for $854 per month and wages amount to $1906 per month. Variable costs…
A:
Q: 4. Suppose that X₁, X2,..., Xn and Y₁, Y2,..., Yn are independent random samples of size n from…
A:
Q: 1. Find the forecasting results based on each year (1991-1995) using the simple linear regression.…
A: Since you have posted a question with multiple sub-parts, we will solve the first three sub-parts…
Q: Listed below are speeds (mi/h) measured from traffic on a busy highway. This simple random sample…
A: From given data we have: 60 61 61 55 61 53 59 58 59 68 62 66 Sample…
Q: 8. What is the approximate probability of exactly two people in a group of seven having the same…
A: Probability is the measure of likelihood of an event. It takes the value in the range 0 to 1. It is…
Q: 2. Defective parts produced by machine 1 and machine 2 using manual and automatic loading of parts…
A: Given the defective parts produced by machine 1 and machine 2 using manual and automatic loading of…
Q: A South African manufacturer of BMW cars offers a model in one of three colors: Blue, Red, or Black.…
A:
Q: In a study of birth order and intelligence, IQ tests were given to 18- and 19-year-old men to…
A:
Q: Consider the following hypothesis test. H0: p = 0.20 Ha: p ≠ 0.20 A sample of 500 provided a sample…
A: As per our guidelines we can solve first question and rest can be reposted. Solution-: Given:…
Q: The drug Eliquis (apixaban) is used to help prevent blood clots in certain patients. In clinical…
A: It is given that Sample size n = 5924 Number of patients with adverse reaction, X = 153 Confidence…
Q: The data below shows car model and the color of vehicles sold at a Car dealership. Hyundai 20 15.40…
A: The two limitations of Chi-square test are given as follows:
Q: If the SST=746, the SSE=516, n=472 and the model of interest is y = Bo + B₁x₁ + B₂x12 + ß3x3 + B4X4…
A:
Q: A racing car consumes a mean of 9292 gallons of gas per race with a standard deviation of 44…
A: Given: Mean, μ=92Std deviation, σ=4n = 41
Q: 7. Find the z-score that cuts off a left tail whose area is 2.5%.
A: given data,here we have to find out the z score for the given bell shaped distribution
Q: A consumer products company is formulating a new shampoo and is interested in foam height (in…
A: This is right tailed test. Also population standard deviation is known.So We will use Z-test.…
Q: 1. An educational researcher says that the proportion of college students who study for their…
A:
Q: Sheet 2 a. Using information from sheet 1, construct, for the two data sets, the following: i.…
A: From part (b)Table 1: Persons with secondary education- To calculate relative frequency, Relative…
Q: Recycling Approximately 70% of the U.S. population recycles. According to a green survey of a random…
A: a) Suppose p is the true proportion of college students, who recycle.
Q: In an experiment to determine whether there is a systematic difference between the weights obtained…
A: The data shows the difference between the weights for two different scales.
Q: 9. Find the z-scores that cut off the middle 90% of the graph from the two tails. 0 10. Find the…
A: given data standard normal distributionZ~N(0,1) area under standard normal curve represents…
Q: d) The weight of 45 watermelons from a farm is shown below. Weight Frequency 11-15 4 16-20 8 21-25…
A: Weight Frequency (f) Mid value (x) Class boundaries f⋅x c.f 11-15 4 13 10.5-15.5 52 4 16-20…
Q: George Towett of Marietta, Georgia finished in first place for the men and Lauren Wald of…
A: By bartleby policy i can gives only 3 subparts answer at a time.
Q: A 3809 E HT Find the mean and standard deviation of these heights. Round your answers to three…
A: Mean and standard deviation of height
Q: Consider the regressions model: ŷ = B₁ + B₁x1 + ₂x2 + Â3X3 + B₁X4 + ß5x5, where n=254 and R²=0.31.…
A: It is given that Number of observations n = 254 R2 = 0.31 Numbe rof explanatory variables p = 5
Q: 3. The steps for used to solve a Central Limit Theorem problem are almost exactly the same as the…
A: Given data The steps used to solve a central limit theorem problem are almost exactly same The…
Q: A certain test preparation course is designed to help students improve their scores on the GRE exam.…
A: Given data is6,12,11,13,26sample size(n)=5confidence level=95%
Q: 6. A bag of 80 candies contains 25% each of orange and blue candies and 12.5% each of brown, red.…
A: given data, n=80p(orange )=0.25p((blue) =0.25p(broen )=0.125p(red)…
Q: 1. Find the correlation coefficient using Spearman rho and interpret results. Road width in feet (x)…
A:
Q: Listed below are brain volumes (cm^2) of unrelated subjects used in a study. Assume the data is…
A: Followings are the Explanation of the question Let X be the brain volumes (cm^2) of unrelated…
Q: Assume both follow a Normal distribution. What can be concluded at the a = .01 level of…
A: Given: n1 = 10 n2 = 10 α = 0.01 Formula Used: Test-statistic t = X1-X2sp1n1+1n2 sp =…
Q: Suppose that the Seadoo of Canada company standard for customer satisfaction is 95% “highly…
A: Hypothesis test are used to compare the sample and population. If the proportion of population…
Q: n experiment consists of rolling two 6-sided dice and observing the numbers on the top of the dice.…
A: roll a two six sided dice. observe the numbers on the top of the dice. number of outcomes in…
Identify the regression analyses necessary for testing this initial model.

Step by step
Solved in 2 steps

- The Conch Café, located in Gulf Shores, Alabama, features casual lunches with a great view of the Gulf of Mexico. To accommodate the increase in business during the summer vacation season, Fuzzy Conch, the owner, hires a large number of servers as seasonal help. When he interviews a prospective server, he would like to provide data on the amount a server can earn in tips. He believes that the amount of the bill and the number of diners are both related to the amount of the tip. He gathered the following sample information. Customer Amount of Tip Amount of Bill Number of Diners Customer Amount of Tip Amount of Bill Number of Diners 1 $ 6.05 $ 73.22 1 16 $ 3.30 $ 23.59 2 2 4.50 28.23 4 17 3.50 22.30 2 3 1.00 10.65 1 18 3.25 32.00 2 4 2.40 19.82 3 19 5.40 50.02 4 5 5.00 28.62 3 20 2.25 17.60 3 6 4.25 24.83 2 21 1.40 41.80 5 7 .50 6.25 1 22 3.00 20.27 2…The Conch Café, located in Gulf Shores, Alabama, features casual lunches with a great view of the Gulf of Mexico. To accommodate the increase in business during the summer vacation season, Fuzzy Conch, the owner, hires a large number of servers as seasonal help. When he interviews a prospective server, he would like to provide data on the amount a server can earn in tips. He believes that the amount of the bill and the number of diners are both related to the amount of the tip. He gathered the following sample information. Customer Amount of Tip Amount of Bill Number of Diners Customer Amount of Tip Amount of Bill Number of Diners 1 $ 7.00 $ 48.97 5 16 $ 3.30 $ 23.59 2 2 4.50 28.23 4 17 3.50 22.30 2 3 1.00 10.65 1 18 3.25 32.00 2 4 2.40 19.82 3 19 5.40 50.02 4 5 5.00 28.62 3 20 2.25 17.60 3 6 4.25 24.83 2 21 5.50 44.47 4 7 0.50 6.24 1 22 3.00 20.27 2…Large companies typically collect volumes of data before designing a product, not only to gain information as to whether the product should be released, but also to pinpoint which markets would be the best targets for the product. Several months ago, I was interviewed by such a company while shopping at a mall. I was asked about my exercise habits and whether or not I'd be interested in buying a video/DVD designed to teach stretching exercises. I fall into the male, 18 – 35-years-old category, and I guessed that, like me, many males in that category would not be interested in a stretching video. My friend Diane falls in the female, older-than-35 category, and I was thinking that she might like the stretching video. After being interviewed, I looked at the interviewer's results. Of the 93 people in my market category who had been interviewed, 17 said they would buy the product, and of the 113 people in Diane's market category, 34 said they would buy it. Assuming that these data came…
- Large companies typically collect volumes of data before designing a product, not only to gain information as to whether the product should be released, but also to pinpoint which markets would be the best targets for the product. Several months ago, I was interviewed by such a company while shopping at a mall. I was asked about my exercise habits and whether or not I'd be interested in buying a video/DVD designed to teach stretching exercises. I fall into the male, 18 – 35-years-old category, and I guessed that, like me, many males in that category would not be interested in a stretching video. My friend Amanda falls in the female, older-than-35 category, and I was thinking that she might like the stretching video. After being interviewed, I looked at the interviewer's results. Of the 97 people in my market category who had been interviewed, 16 said they would buy the product, and of the 101 people in Amanda's market category, 31 said they would buy it. Assuming that these data came…Large companies typically collect volumes of data before designing a product, not only to gain information as to whether the product should be released, but also to pinpoint which markets would be the best targets for the product. Several months ago, I was interviewed by such a company while shopping at a mall. I was asked about my exercise habits and whether or not I'd be interested in buying a video/DVD designed to teach stretching exercises. I fall into the male, 18-35-years-old category, and I guessed that, like me, many males in that category would not be interested in a stretching video. My friend Holly falls in the female, older-than-35 category, and I was thinking that she might like the stretching video. After being interviewed, I looked at the interviewer's results. Of the 89 people in my market category who had been interviewed, 20 said they would buy the product, and of the 103 people in Holly's market category, 28 said they would buy it. Assuming that these…The maximum discount value of the Entertainment® card for the “Fine Dining” section, Edition 10, for various pages is given below. Page number Maximum value ($)4 1614 1925 1532 1743 1957 1572 1685 1590 17a) Decide which variable should be the independent variable and which should be the dependent variable. Justify your choice. b) Draw a scatter plot of the ordered pairs. c) Does it appear that the restaurants giving the maximum value are placed in the beginning of the “Fine Dining” section? How did you arrive at your answer? d) What is the slope of the least squares (best-fit) line? Interpret the slope. e) What is the intercept of the least squares (best-fit) line? Interpret the intercept. f) Write down the equation for the least squares line. Interpret your equation. g) Find the estimated maximum…
- Use the data and create a model that estimates a student's giving rate as an alumni based on the three parameters provided. As the Student-Faculty Ratio increases, the Alumni Giving Rate declines. Group of answer choices True False University Graduation Rate % of Classes Under 20 Student-Faculty Ratio Alumni Giving Rate Boston College 85 39 13 25 Brandeis University 79 68 8 33 Brown University 93 60 8 40 California Institute of Technology 85 65 3 46 Carnegie Mellon University 75 67 10 28 Case Western Reserve Univ. 72 52 8 31 College of William and Mary 89 45 12 27 Columbia University 90 69 7 31 Cornell University 91 72 13 35 Dartmouth College 94 61 10 53 Duke University 92 68 8 45 Emory University 84 65 7 37 Georgetown University 91 54 10 29 Harvard University 97 73 8 46 Johns Hopkins University 89 64 9 27 Lehigh University 81 55 11 40 Massachusetts Inst. of Technology 92 65 6 44 New York University 72 63 13 13 Northwestern…Test the following data to see whether they are linear. (Choose one.) x- 3, 5, 7,9 y- 11,15,22,23 Linear or Not Linear?Occupational prestige scores for a sample of fathers and their oldest son and oldest daughter are presented in the following tables. Analyze the relationship between father’s and son’s prestige, and the relationship between father’s and daughter’s prestige. Compute r and r Describe the strength and the direction of the relationship in a sentence or two. Does Occupational prestige of the father have an impact on his children. Does it have the same impact for his daughters as it does for sons?(Please ensure that you utilize the five-step model and show all your work when addressing the question) Family Father’s Prestige Son’s Prestige Daughter’s Prestige A 80 85 82 B 78 80 77 C 75 70 68 D 70 75 77 E 69 72 60 F 66 60 52 G 64 48 48 H 52 55 57
- The following data give X, the price charged per piece of plywood, and Y, the quantity sold (in thousands).Price per Piece, X Thousands of Pieces Sold, Y $6 80 7 60 8 70 9 40 10 0a. Prepare a scatter plot of these data points.b. Compute the covariance.c. Compute and interpret b1.d. Compute b0.e. What quantity of plywood would you expect to sell if the price were $7 per piece?A glass manufacturing company wanted to investigate the effect of breakoff pressure and stopper height on the percentage of breaking off chips. The results are in the accompanying table. Complete parts (a) through (e). a. At the 0.01 level of significance is there an interaction between the breakoff pressure and the stopper height? b. is there an effect due to the breakoff pressure? c. is there an effect due to the stopper height? d. Plot the percentage breakoff for each breakoff pressure for each stopper height. e. Discuss the results of (a) through (d).The following data represent the results of a repeated-measures study comparing different viewing distances for a 42-inch-high-definition television. Four viewing distances were evaluated, 9 feet, 12 feet, 15 feet, and 18 feet. Each participant was free to move back and forth among the four distances while watching a 30-minute video on the television. The only restriction was that each person had to spend at least 2 minutes watching from each of the four distances. At the end of the video, each participant rated the all off of the viewing distances on a scale from 1 (very bad, definitely need to move closer or father way) to 7 (excellent, perfect viewing distance). Use a repeated-measures ANOVA with alpha = 0.05 to determine whether there is significant difference among the four viewing distances.