a. Is there a significant difference on the ratings of the respondents on Product Line-X11) when grouped according to Industry Type - X2? T-Test for Letter A Group Statistics
a. Is there a significant difference on the ratings of the respondents on Product Line-X11) when grouped according to Industry Type - X2? T-Test for Letter A Group Statistics

Glencoe Algebra 1, Student Edition, 9780079039897, 0079039898, 2018
18th Edition
ISBN:9780079039897
Author:Carter
Publisher:Carter
Chapter10: Statistics
Section10.4: Distributions Of Data
Problem 19PFA

Related questions
Question
explain thoroughly in details of the spss result
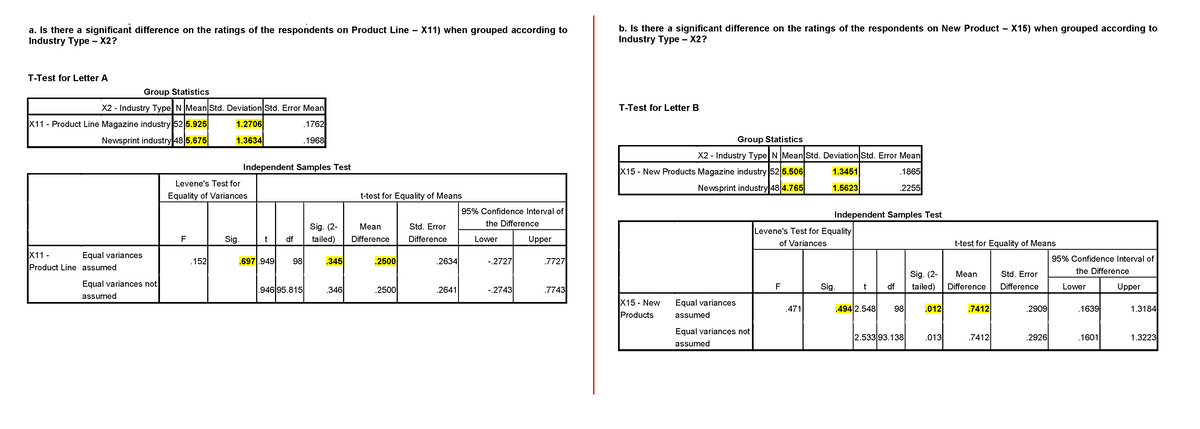
Transcribed Image Text:a. Is there a significant difference on the ratings of the respondents on Product Line - X11) when grouped according to
Industry Type - X2?
T-Test for Letter A
Group Statistics
X2 - Industry Type N Mean Std. Deviation Std. Error Mean
X11 - Product Line Magazine industry 52 5.925
Newsprint industry 48 5.675
1.2706
.1762
1.3634
.1968
X11 -
Product Line assumed
Equal variances
Equal variances not
assumed
Levene's Test for
Equality of Variances
.152
Independent Samples Test
Sig.
t
.697.949
df
98
.946 95.815
Sig. (2-
tailed)
.345
.346
t-test for Equality of Means
Mean
Difference
.2500
.2500
Std. Error
Difference
.2634
.2641
95% Confidence Interval of
the Difference
Lower
-.2727
-.2743
Upper
.7727
.7743
b. Is there a significant difference on the ratings of the respondents on New Product - X15) when grouped according to
Industry Type - X2?
T-Test for Letter B
Group Statistics
X2 - Industry Type N Mean Std. Deviation Std. Error Mean
X15 - New Products Magazine industry 52 5.506
1.3451
Newsprint industry 48 4.765
1.5623
.1865
.2255
X15 - New
Products
Equal variances
assumed
Equal variances not
assumed
Levene's Test for Equality
of Variances
F
Independent Samples Test
.471
Sig.
.494 2.548
df
98
2.533 93.138
Sig. (2-
tailed)
.012
.013
t-test for Equality of Means
Mean
Difference
.7412
.7412
Std. Error
Difference
.2909
.2926
95% Confidence Interval of
the Difference
Lower
.1639
.1601
Upper
1.3184
1.3223
Expert Solution
This question has been solved!
Explore an expertly crafted, step-by-step solution for a thorough understanding of key concepts.

Step by step
Solved in 3 steps

Recommended textbooks for you
Glencoe Algebra 1, Student Edition, 9780079039897…
Algebra
ISBN:
9780079039897
Author:
Carter
Publisher:
McGraw Hill
Glencoe Algebra 1, Student Edition, 9780079039897…
Algebra
ISBN:
9780079039897
Author:
Carter
Publisher:
McGraw Hill