The following figures are the production data of a sugar factory. Year : |1988 |1989 |1990 1991 1992 1993 1994| 1995 1996|1997|1998 Prodn. (in '000 tonnes) : 0 19 2 24 40 35 55 51 74 79 17 20 Fit a trend of the type Y = a + bX + cX² to the above data (select the year 1993 as the working origin).
The following figures are the production data of a sugar factory. Year : |1988 |1989 |1990 1991 1992 1993 1994| 1995 1996|1997|1998 Prodn. (in '000 tonnes) : 0 19 2 24 40 35 55 51 74 79 17 20 Fit a trend of the type Y = a + bX + cX² to the above data (select the year 1993 as the working origin).

Chapter5: Exponential And Logarithmic Functions
Section5.5: Exponential And Logarithmic Models
Problem 4ECP

Related questions
Question
Time series, statistics
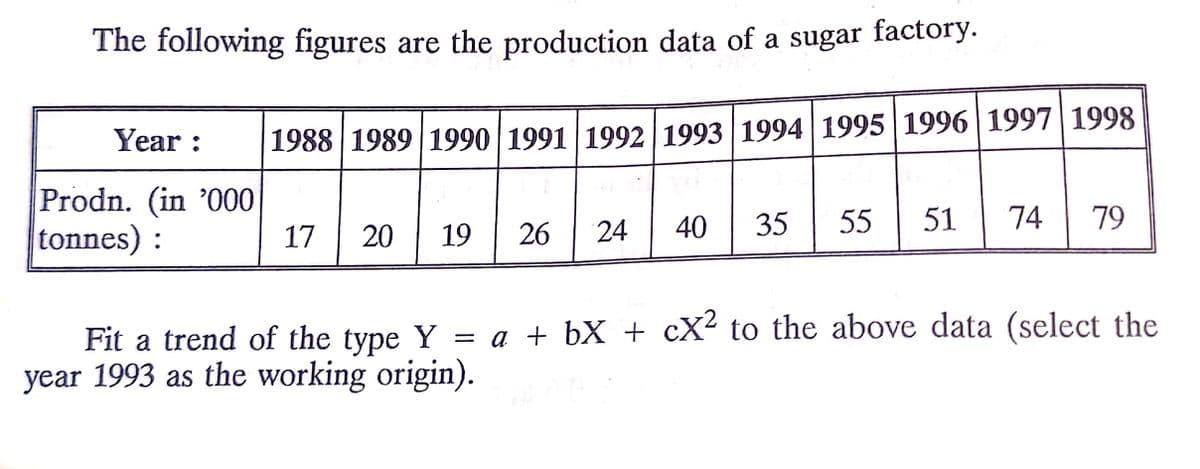
Transcribed Image Text:The following figures are the production data of a sugar factory.
Year :
1988 | 1989 | 1990 1991 | 1992 1993 1994 |1995 1996 | 1997| 1998
Prodn. (in '000
tonnes) :
51| 74
20||
35
55
79
17
19
26
24
40
= a + bX + cX² to the above data (select the
Fit a trend of the type Y
year 1993 as the working origin).
Expert Solution
This question has been solved!
Explore an expertly crafted, step-by-step solution for a thorough understanding of key concepts.

This is a popular solution!

Trending now
This is a popular solution!

Step by step
Solved in 4 steps with 4 images

Recommended textbooks for you

Trigonometry (MindTap Course List)
Trigonometry
ISBN:
9781337278461
Author:
Ron Larson
Publisher:
Cengage Learning

Glencoe Algebra 1, Student Edition, 9780079039897…
Algebra
ISBN:
9780079039897
Author:
Carter
Publisher:
McGraw Hill
Trigonometry (MindTap Course List)
Trigonometry
ISBN:
9781337278461
Author:
Ron Larson
Publisher:
Cengage Learning
Glencoe Algebra 1, Student Edition, 9780079039897…
Algebra
ISBN:
9780079039897
Author:
Carter
Publisher:
McGraw Hill

Functions and Change: A Modeling Approach to Coll…
Algebra
ISBN:
9781337111348
Author:
Bruce Crauder, Benny Evans, Alan Noell
Publisher:
Cengage Learning

Algebra & Trigonometry with Analytic Geometry
Algebra
ISBN:
9781133382119
Author:
Swokowski
Publisher:
Cengage