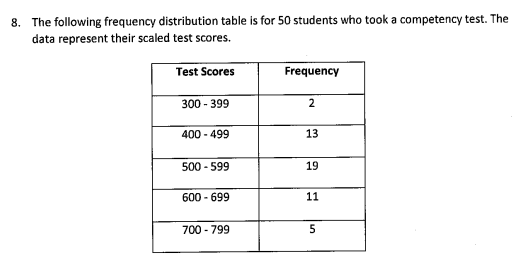
The following frequency distribution table is for 50 students who took a competency test. The data represent their scaled test scores. Test Scores Frequency 300 - 399 2 400 - 499 13 500 - 599 19 600 - 699 11 700 - 799 5
The following frequency distribution table is for 50 students who took a competency test. The data represent their scaled test scores. Test Scores Frequency 300 - 399 2 400 - 499 13 500 - 599 19 600 - 699 11 700 - 799 5

Glencoe Algebra 1, Student Edition, 9780079039897, 0079039898, 2018
18th Edition
ISBN:9780079039897
Author:Carter
Publisher:Carter
Chapter10: Statistics
Section10.6: Summarizing Categorical Data
Problem 4AGP

Related questions
Question
How many classes are there and what is the class width?
Transcribed Image Text:8. The following frequency distribution table is for 50 students who took a competency test. The
data represent their scaled test scores.
Test Scores
Frequency
300 - 399
2
400 - 499
13
500 - 599
19
600 - 699
11
700 - 799
Expert Solution
Step 1
| Test scores | Frequency |
| 300-399 | 2 |
| 400-499 | 13 |
| 500-599 | 19 |
| 600-699 | 11 |
| 700-799 | 5 |

Trending now
This is a popular solution!

Step by step
Solved in 3 steps

Recommended textbooks for you
Glencoe Algebra 1, Student Edition, 9780079039897…
Algebra
ISBN:
9780079039897
Author:
Carter
Publisher:
McGraw Hill
Glencoe Algebra 1, Student Edition, 9780079039897…
Algebra
ISBN:
9780079039897
Author:
Carter
Publisher:
McGraw Hill