The following frequency histogram represents the IQ scores of a random sample of seventh-grade students. IQs are measured to the nearest whole number. The frequency of each class is labeled above each rectangle. Use the histogram to answers parts (a) through (g). IQs of 7th Grade Students 80- 60- 40- 20- 60 70 80 90 100 110 120 130 140 150 160 IQ scores (a) How many students were sampled? students (b) Determine the class width. The class width is (c) Identify the classes and their frequencies. Choose the correct answer below. O A. 60-70, 1; 70-80, 4; 80-90, 13; 90-100, 49; 100-110, 46; 110-120, 42; 120-130, 33; 130-140, 8; 140-150, 2; 150-160, 2 O B. 65, 1; 75, 4; 85, 13; 95, 49; 105, 46; 115, 42; 125, 33; 135, 8; 145, 2; 155, 2 Oc. 60-69, 1; 70-79, 4; 80-89, 13; 90-99, 49; 100-109, 46; 110-119, 42; 120-129, 33; 130-139, 8; 140-149, 2; 150-159, 2 (d) Which class has the highest frequency? O A. 95 O B. 100-109 O c. 90-99 O D. 90-100
The following frequency histogram represents the IQ scores of a random sample of seventh-grade students. IQs are measured to the nearest whole number. The frequency of each class is labeled above each rectangle. Use the histogram to answers parts (a) through (g). IQs of 7th Grade Students 80- 60- 40- 20- 60 70 80 90 100 110 120 130 140 150 160 IQ scores (a) How many students were sampled? students (b) Determine the class width. The class width is (c) Identify the classes and their frequencies. Choose the correct answer below. O A. 60-70, 1; 70-80, 4; 80-90, 13; 90-100, 49; 100-110, 46; 110-120, 42; 120-130, 33; 130-140, 8; 140-150, 2; 150-160, 2 O B. 65, 1; 75, 4; 85, 13; 95, 49; 105, 46; 115, 42; 125, 33; 135, 8; 145, 2; 155, 2 Oc. 60-69, 1; 70-79, 4; 80-89, 13; 90-99, 49; 100-109, 46; 110-119, 42; 120-129, 33; 130-139, 8; 140-149, 2; 150-159, 2 (d) Which class has the highest frequency? O A. 95 O B. 100-109 O c. 90-99 O D. 90-100

Glencoe Algebra 1, Student Edition, 9780079039897, 0079039898, 2018
18th Edition
ISBN:9780079039897
Author:Carter
Publisher:Carter
Chapter10: Statistics
Section10.6: Summarizing Categorical Data
Problem 23PPS

Related questions
Question
4
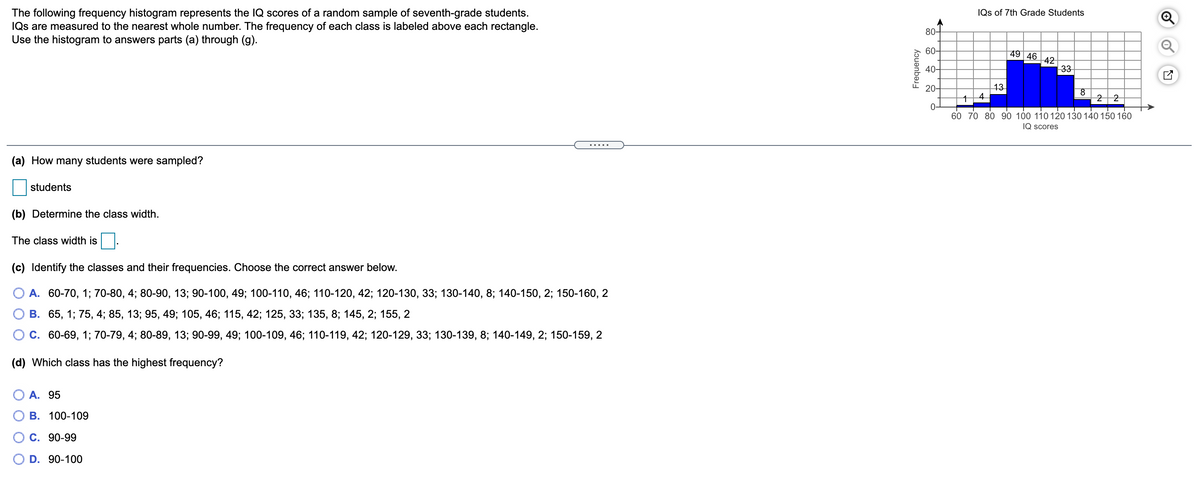
Transcribed Image Text:The following frequency histogram represents the IQ scores of a random sample of seventh-grade students.
IQs are measured to the nearest whole number. The frequency of each class is labeled above each rectangle.
Use the histogram to answers parts (a) through (g).
IQs of 7th Grade Students
80+
60-
49 46
42
33
40-
13
4.
20-
8.
2 2
0-
60 70 80 90 100 110 120 130 140 150 160
IQ scores
.....
(a) How many students were sampled?
students
(b) Determine the class width.
The class width is
(c) Identify the classes and their frequencies. Choose the correct answer below.
А. 60-70, 1; 70-80, 4;B 80-90, 13; 90-100, 49; 100-110, 46;B 110-120, 42;B 120-130, 3;B 130-140, 8; 140-150, 2; 150-160, 2
В. 65, 1; 75, 4; 85, 13; 95, 49; 105, 46;B 115, 42;B 125, 33; 135, 8; 145, 2;B 155, 2
С. 60-69, 1; 70-79, 4;B 80-89, 13;B 90-99, 49;B 100-109, 46;B 110-119, 42; 120-129, 33; 130-139, 8; 140-149, 2;B 150-159, 2
(d) Which class has the highest frequency?
Α. 95
В. 100-109
С. 90-99
D. 90-100
Frequency
Expert Solution
This question has been solved!
Explore an expertly crafted, step-by-step solution for a thorough understanding of key concepts.

This is a popular solution!

Trending now
This is a popular solution!

Step by step
Solved in 2 steps with 1 images

Recommended textbooks for you
Glencoe Algebra 1, Student Edition, 9780079039897…
Algebra
ISBN:
9780079039897
Author:
Carter
Publisher:
McGraw Hill
Glencoe Algebra 1, Student Edition, 9780079039897…
Algebra
ISBN:
9780079039897
Author:
Carter
Publisher:
McGraw Hill