In a national survey conducted by the Centers for Disease Control in order to determine health-risk behaviors among college students, college students were asked, "How often do you wear a seatbeit when riding in a car driven by someone else?"The frequencies are displayed below. RESPONSE FREQUENCY Never 125 Rarely 324 Sometimes 552 Most of the Time 1257 Always 2518 distribution. (0) Construct a frequency bar graph.
In a national survey conducted by the Centers for Disease Control in order to determine health-risk behaviors among college students, college students were asked, "How often do you wear a seatbeit when riding in a car driven by someone else?"The frequencies are displayed below. RESPONSE FREQUENCY Never 125 Rarely 324 Sometimes 552 Most of the Time 1257 Always 2518 distribution. (0) Construct a frequency bar graph.

Glencoe Algebra 1, Student Edition, 9780079039897, 0079039898, 2018
18th Edition
ISBN:9780079039897
Author:Carter
Publisher:Carter
Chapter10: Statistics
Section: Chapter Questions
Problem 13PT

Related questions
Question
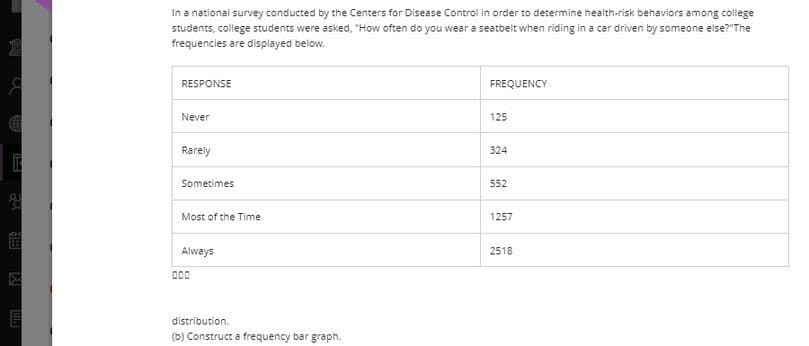
Transcribed Image Text:In a national survey conducted by the Centers for Disease Control in order to determine health-risk behaviors among college
students, college students were asked, "How often do you wear a seatbelt when riding in a car driven by someone else?"The
frequencies are displayed below.
RESPONSE
FREQUENCY
Never
125
Rarely
324
Sometimes
552
Most of the Time
1257
Always
2518
distribution.
(b) Construct a frequency bar graph.
Expert Solution
This question has been solved!
Explore an expertly crafted, step-by-step solution for a thorough understanding of key concepts.

This is a popular solution!

Trending now
This is a popular solution!

Step by step
Solved in 2 steps with 1 images

Recommended textbooks for you
Glencoe Algebra 1, Student Edition, 9780079039897…
Algebra
ISBN:
9780079039897
Author:
Carter
Publisher:
McGraw Hill
Glencoe Algebra 1, Student Edition, 9780079039897…
Algebra
ISBN:
9780079039897
Author:
Carter
Publisher:
McGraw Hill